This was a collection of the entire a, growing series of posts about the ‘little of visualisation design’, respecting the small decisions that make a big difference towards the good and bad of this discipline. In each post I’m going to focus on just one small matter – a singular good or bad design choice – as demonstrated by a sample project. Each project may have many effective and ineffective aspects, but I’m just commenting on one.
Part 1: Duplicate labelling

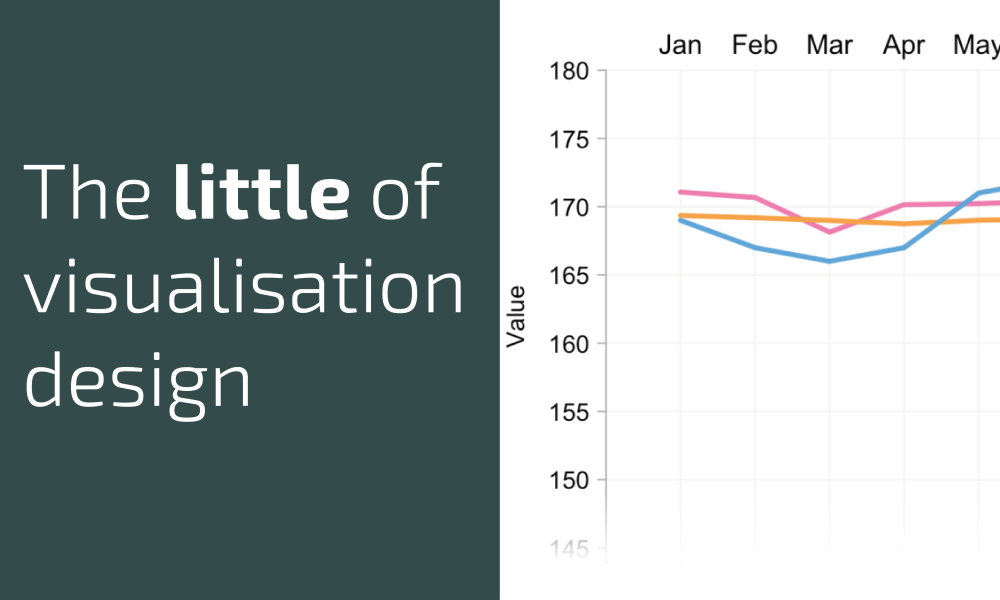
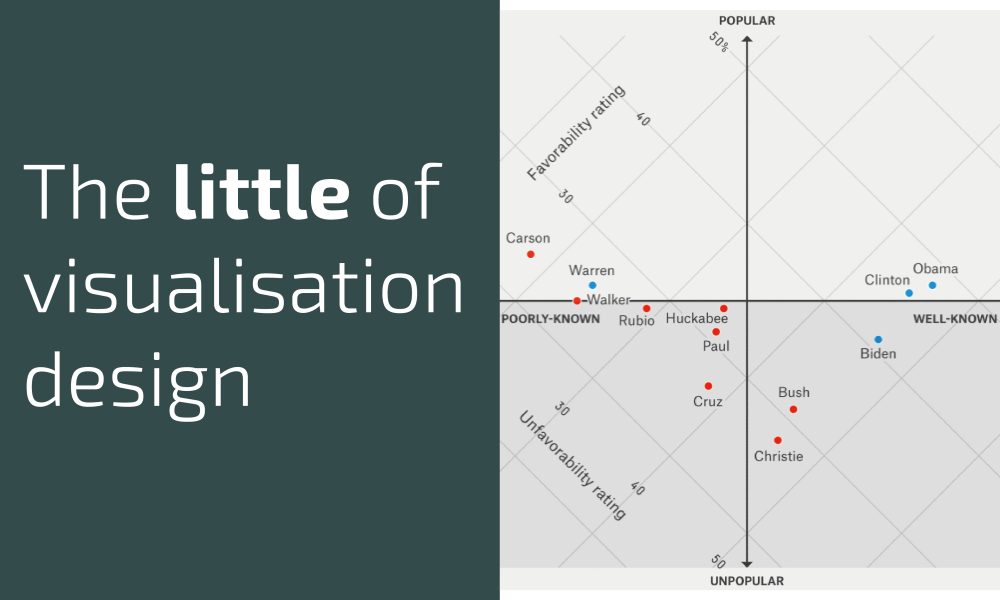
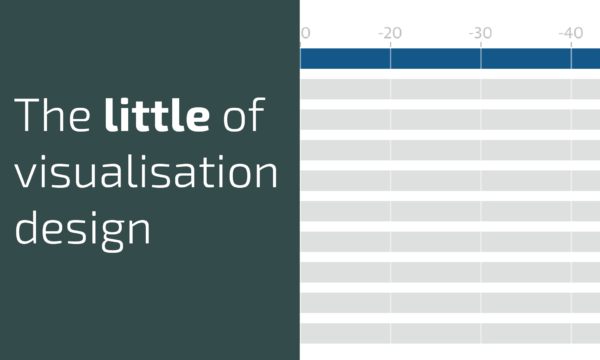
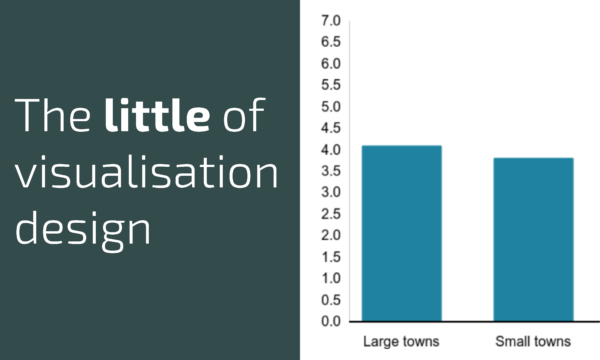
Part 2: Axis-scaling

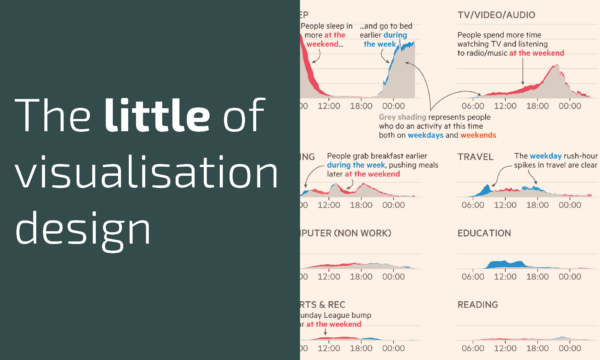
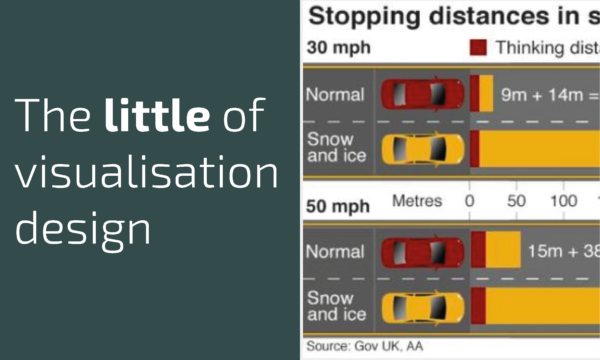
Part 3: Integrating graphics into text
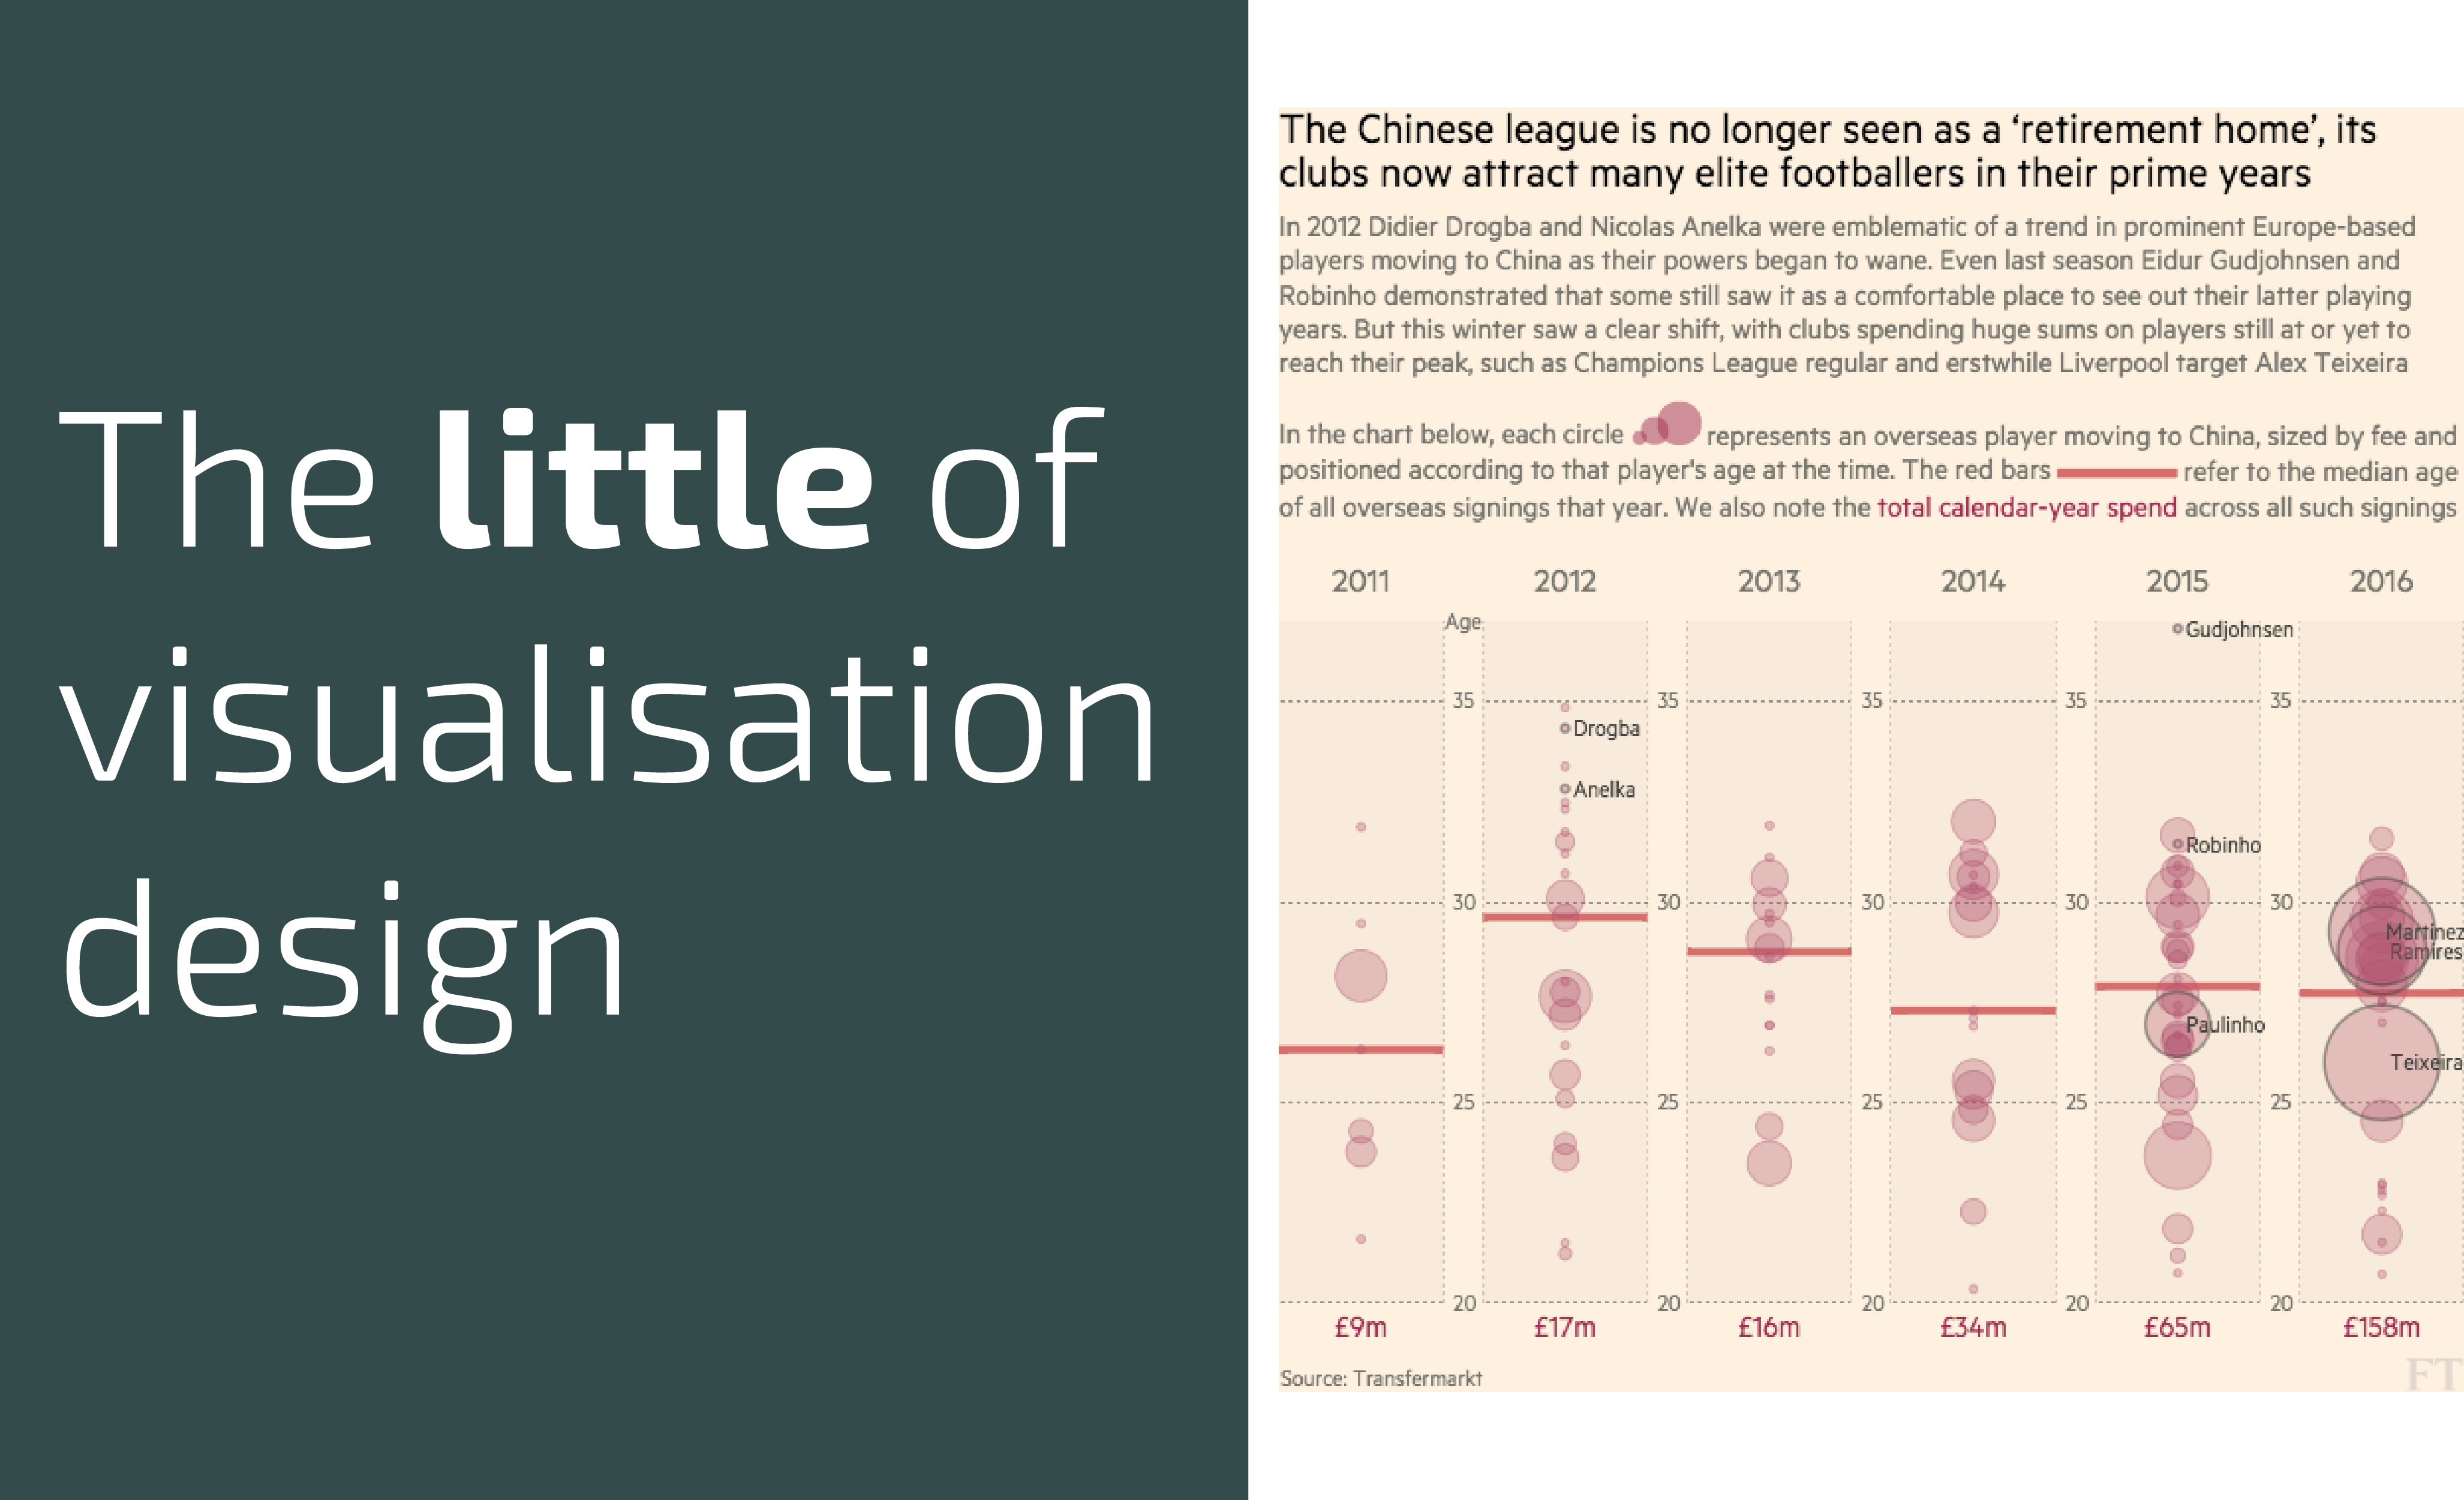
Part 4: Data doubts

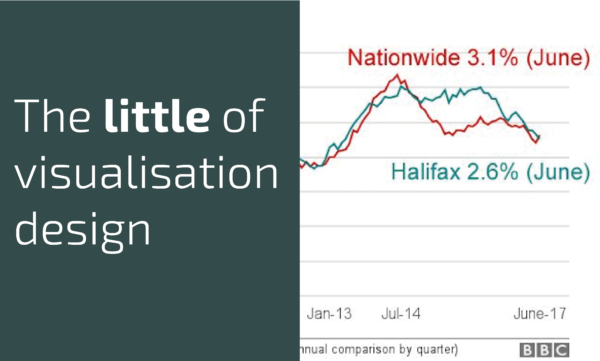
Part 5: Axis line fading
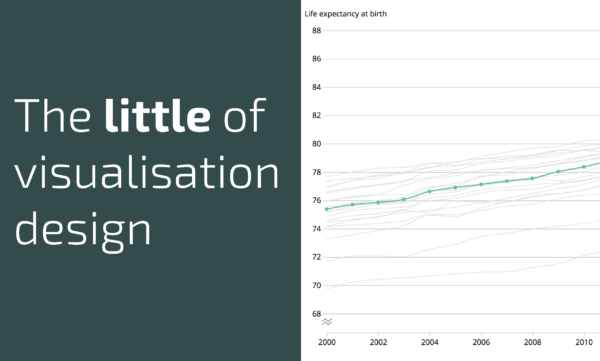
Part 6: Imposed colours
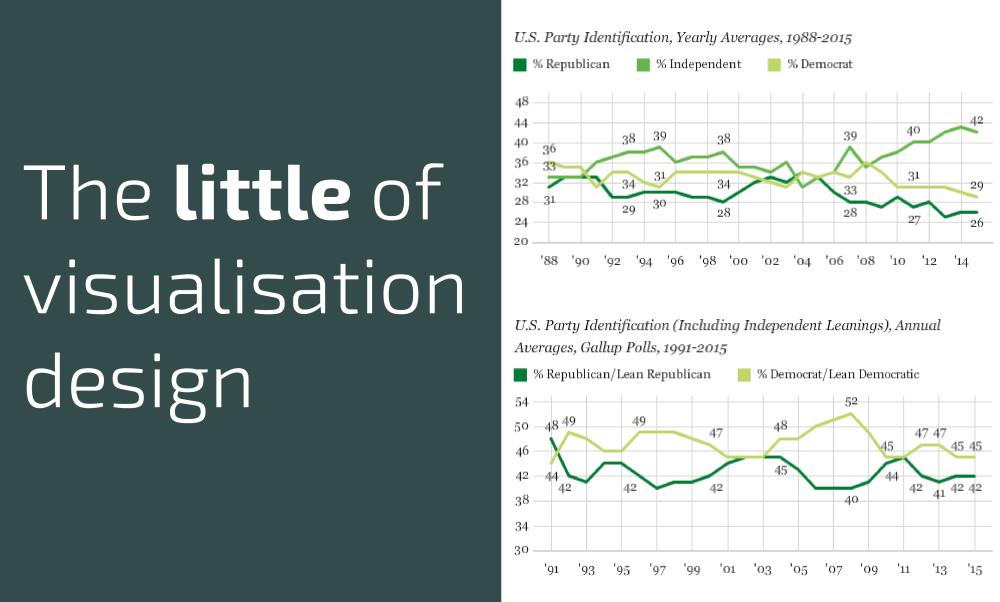
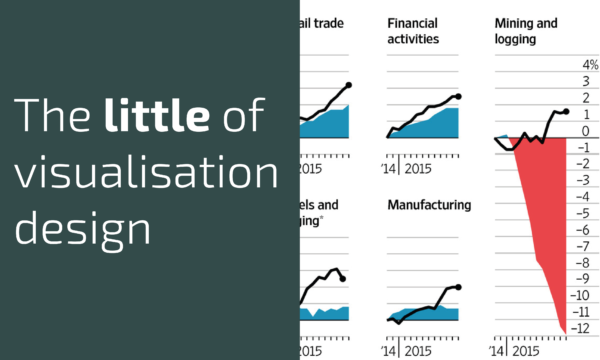
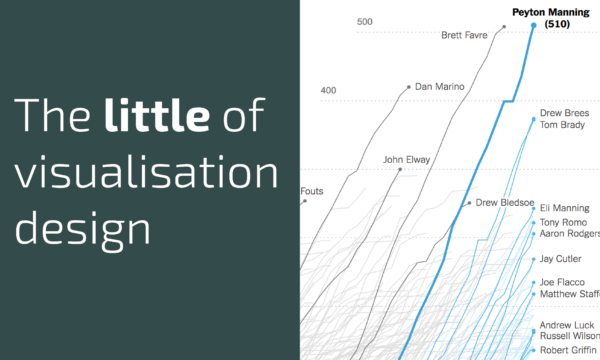
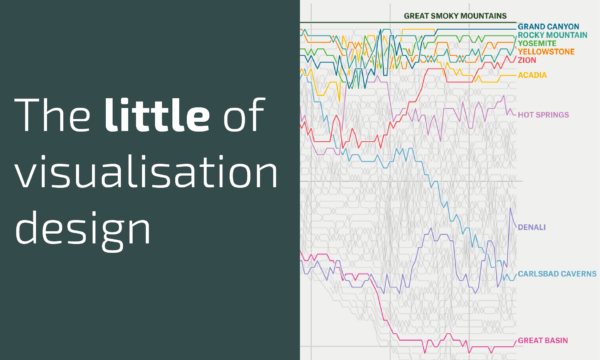
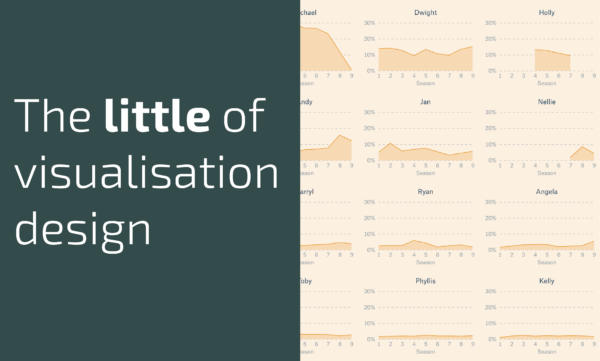
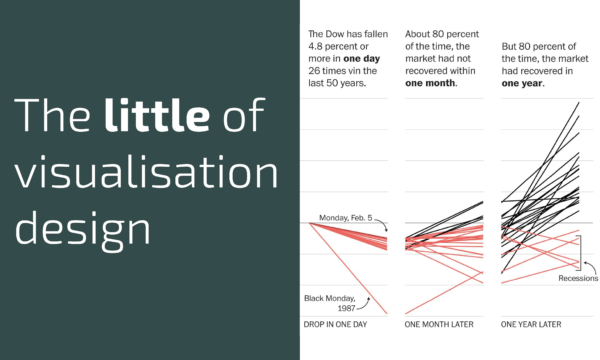
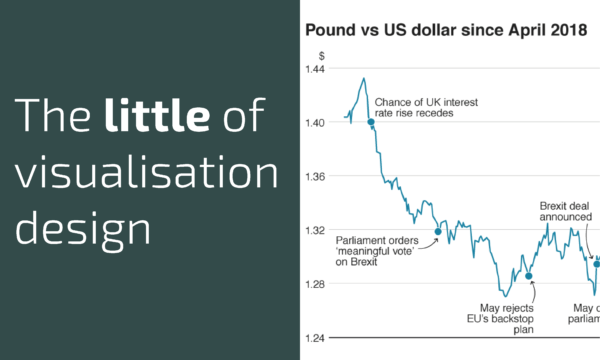
Part 7: Connecting data points
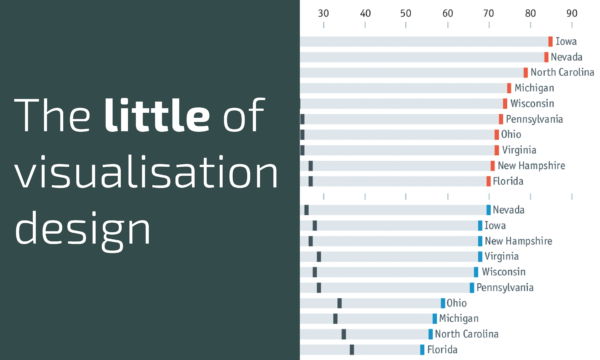
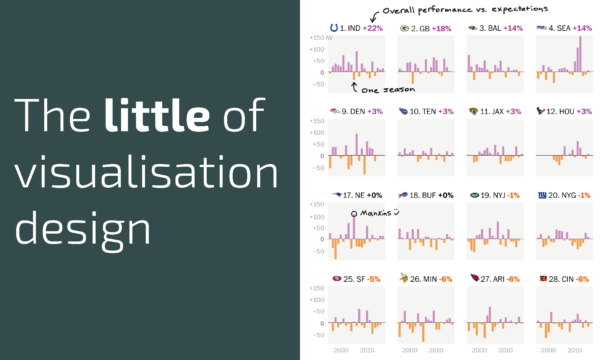
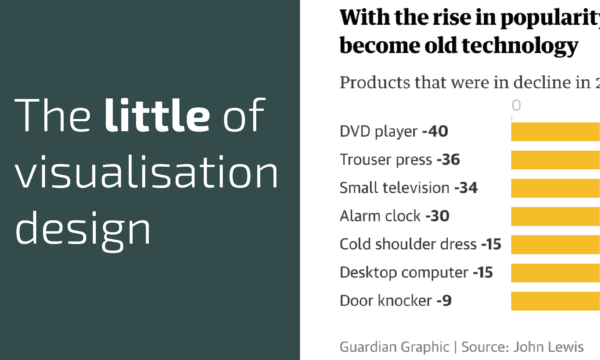
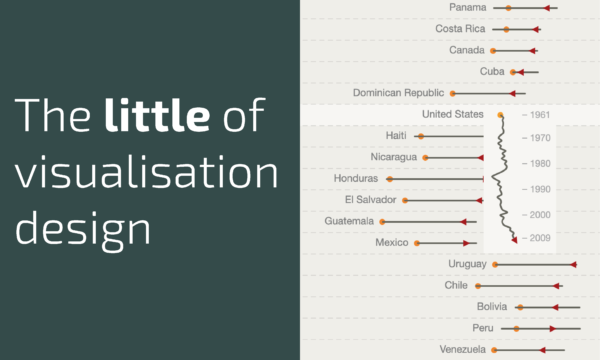
Part 8: Chart orientation
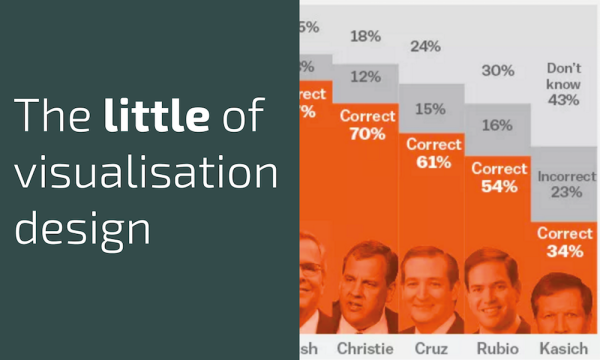
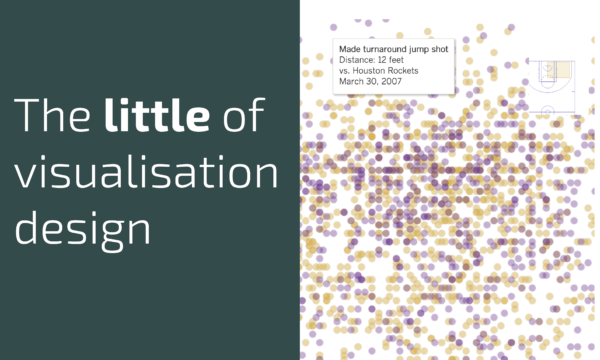
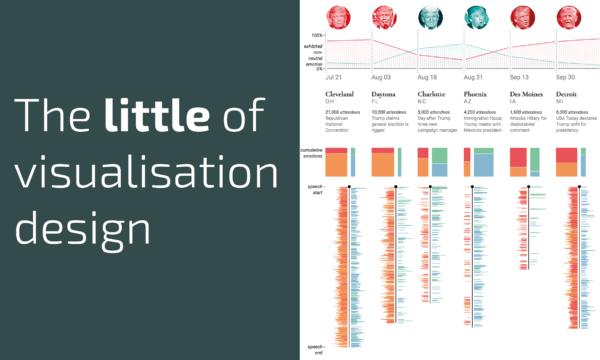
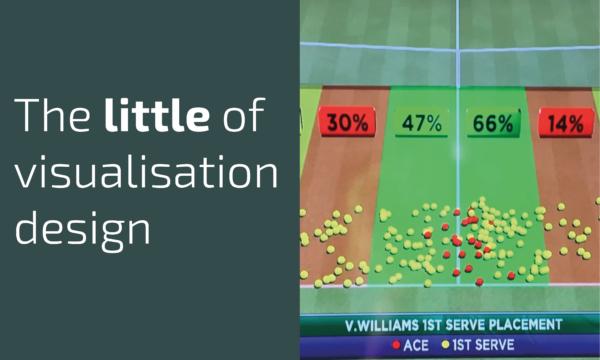
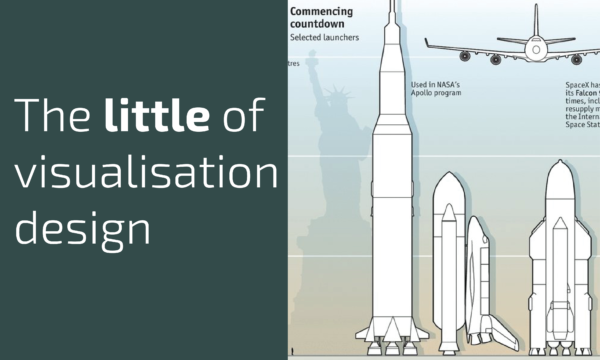
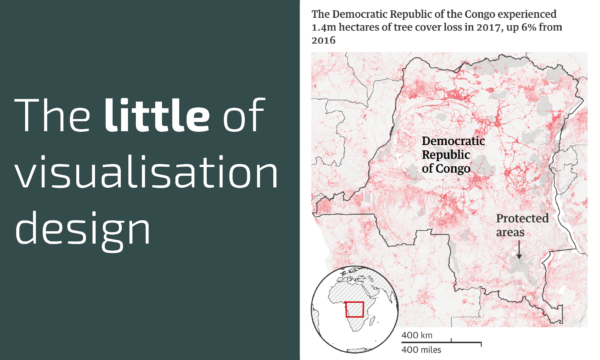
Part 9: Juxtaposing photo-imagery
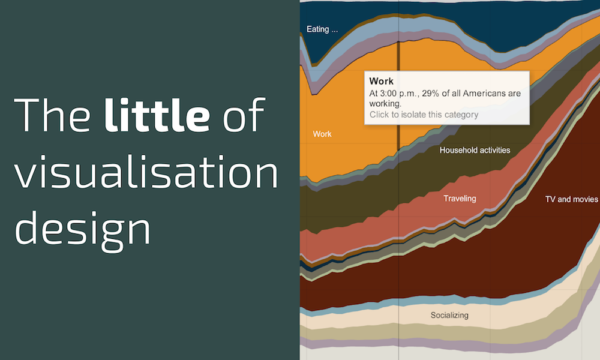
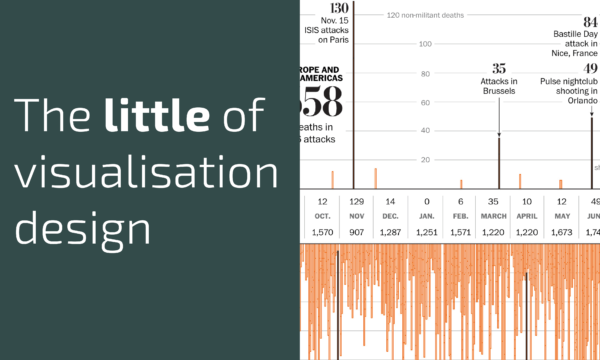
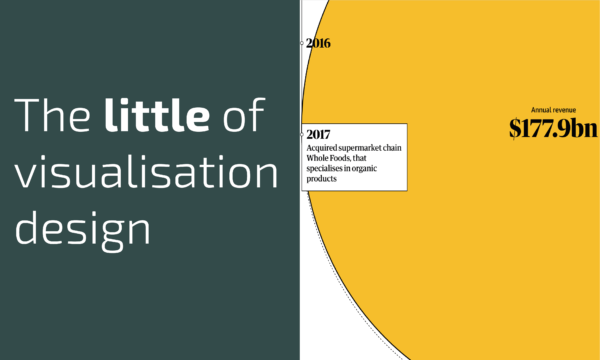
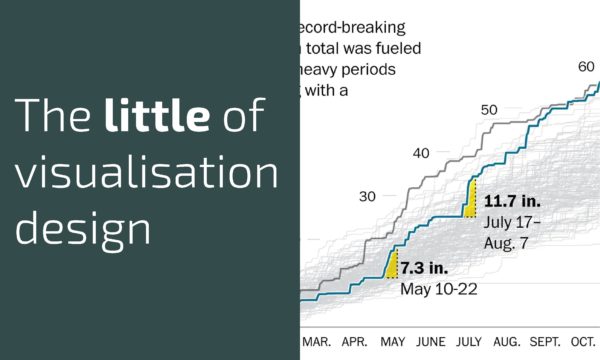
Part 10: Enhanced annotations

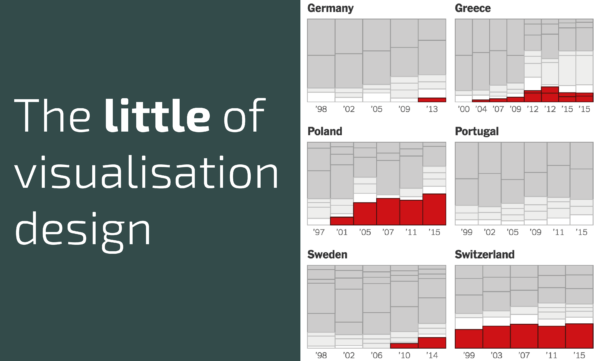
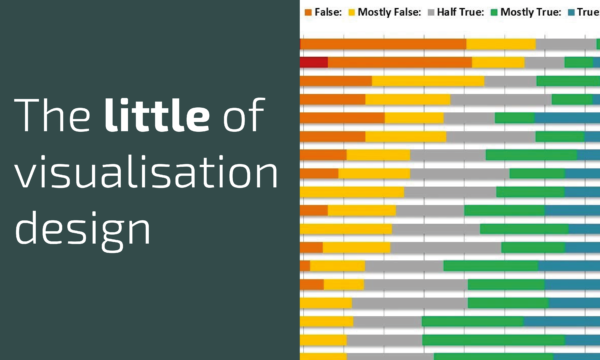
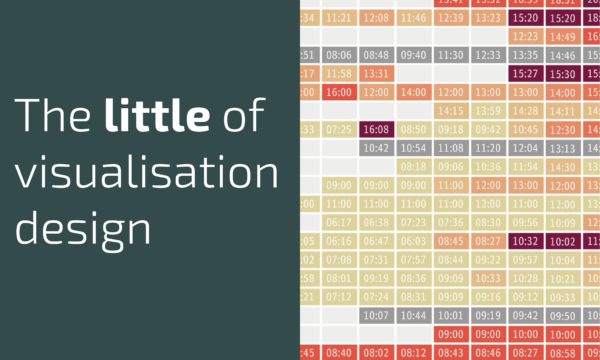
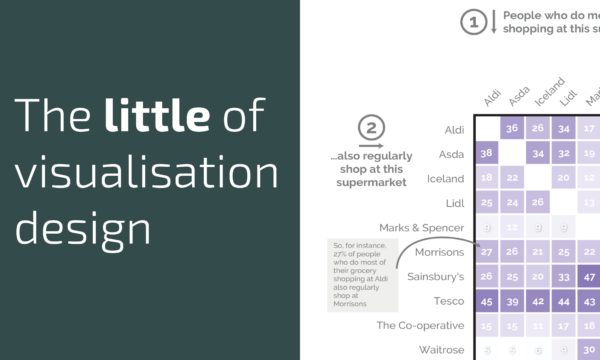
Part 11: Divergent colour shades

Part 12: Visual guides
Part 13: Orientation assistance
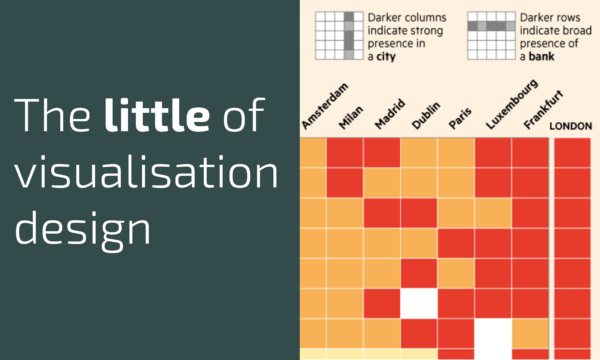
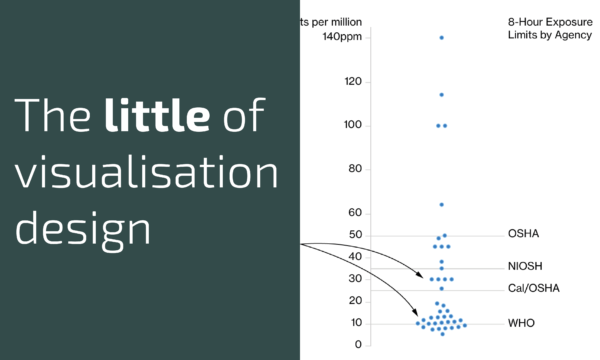
Part 14: Better colour keys

Part 15: Colour key titles

Part 16: Exceptional composition
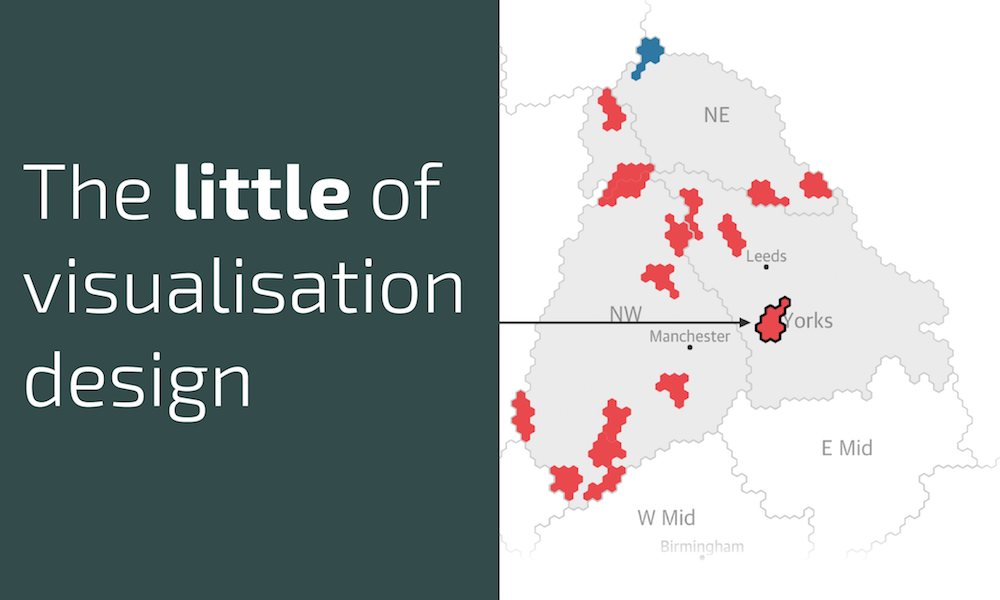
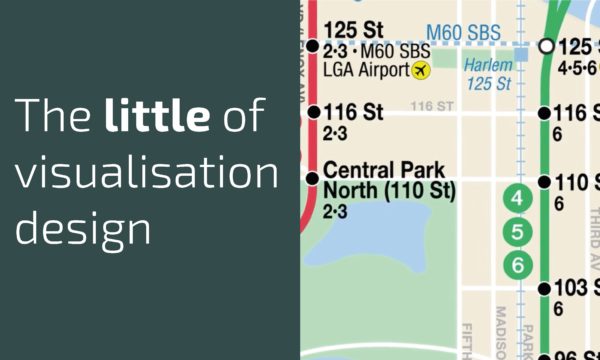
Part 17: Spatial referencing

Part 18: Label alignment
Part 19: Editorial salience
Part 20: Eliminating mistakes

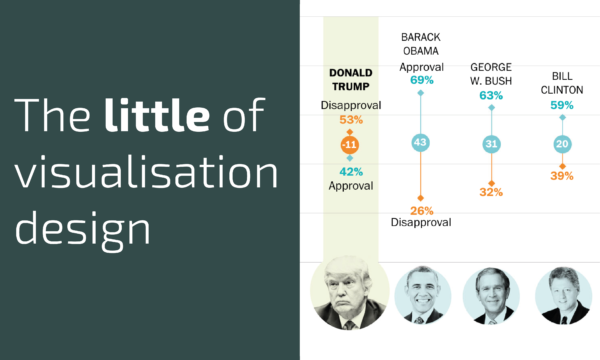
Part 21: Central baseline
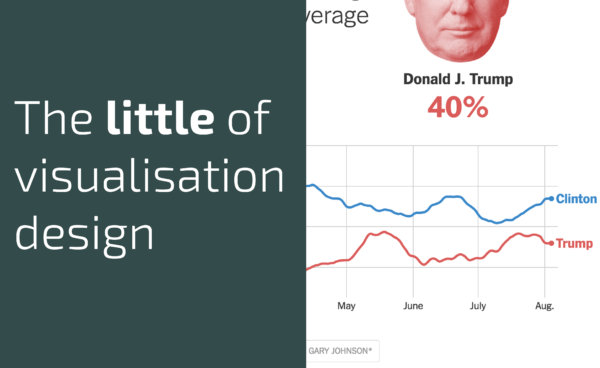
Part 22: ‘Show Gary Johnson’
Part 23: Locating Y-axis Labels
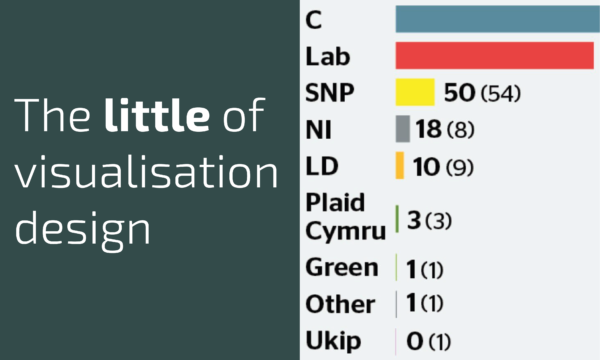
Part 24: (Mis)handling Long Values

Part 25: Arrows

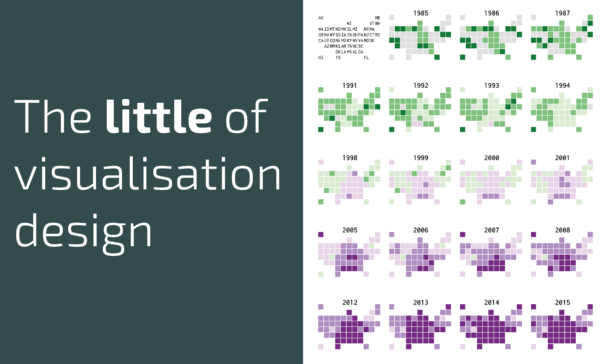
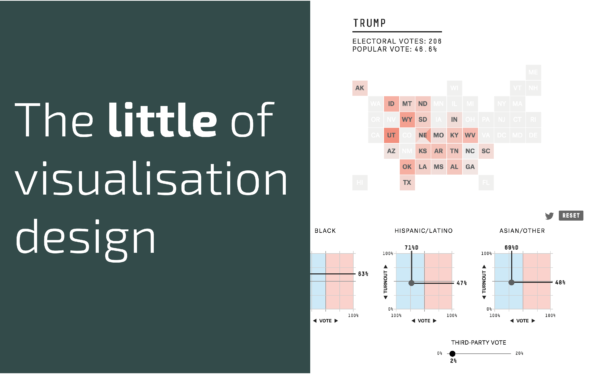
Part 26: Grid Map Legend
Part 27: Reset button
Part 28: Reader guides
Part 29: Editorial overlays
Part 30: Call to action

Part 31: Seamless help

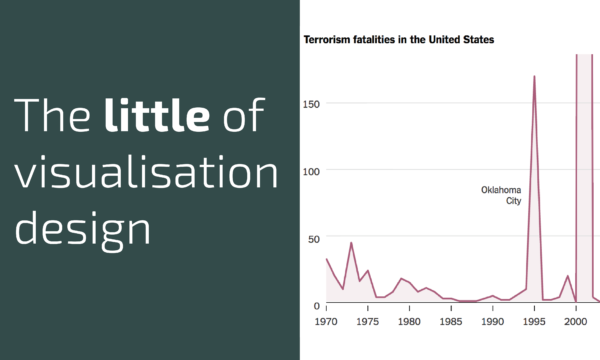
Part 32: Cropping outliers
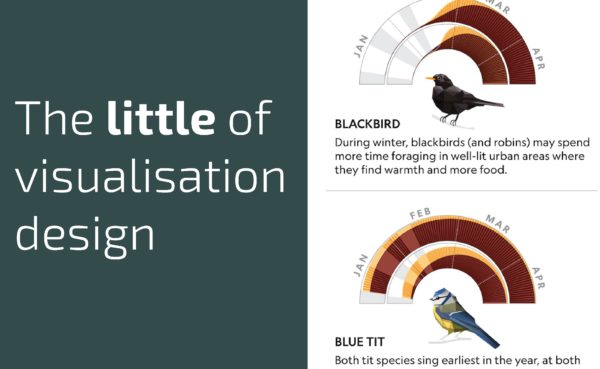
Part 33: Utilising archetypes

Part 34: Statements of accuracy
Part 35: Composition of photo-imagery
Part 36: Cropped gridlines
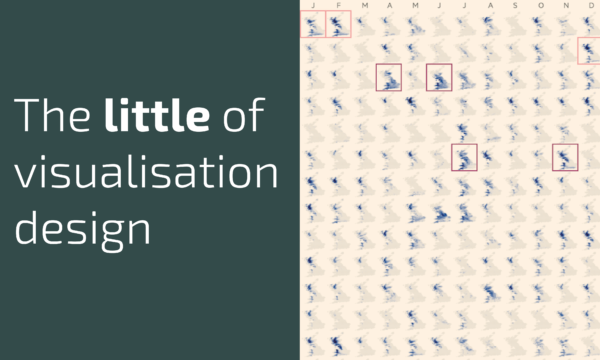
Part 37: Consistent row spacing
Part 38: Sketchy-styled annotations
Part 39: Unnecessary brainwork

Part 40: Axis label intervals
Part 41: Distinct colouring
Part 42: Fading small values

Part 43: Z-sorting
Part 44: Invisible visible gridlines
Part 45: Exploiting heading space

Part 46: Annotation redundancy?
Part 47: Clever label placement

Part 48: Sensible axis intervals

Part 49: Scale comparisons
Part 50: Pictogram composition

Part 51: Exceeding spatial limits
Part 52: Framing containers
Part 53: Thumbnail map reference
Part 54: Axis line truncation
Part 55: Redundant encoding

Part 56: Value dissonance
Part 57: Baseline styling
Part 58: Chart-pattern highlighters
Part 59: Value label colouring
Part 60: Value label styling

Part 61: Exploiting shapes and spaces
Part 62: Misleading size cues
Part 63: Reading assistance
Part 64: Irregular axis scales
Part 65: Structural colour associations

Part 66: User-interaction prompts

Part 67: Expanded chart view
Part 68: Faded value labels

Part 69: Redundant axis scales
Part 70: Clever transition effects
Part 71: Lasso rope pointer

Part 72: Colouring for editorial emphasis