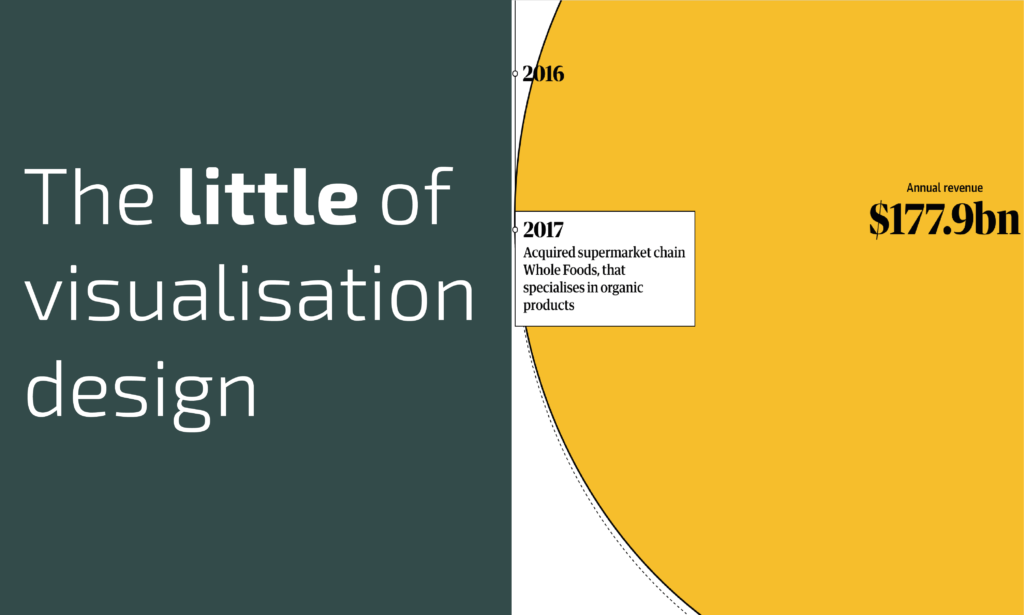
This is part of a series of posts about the ‘little of visualisation design’, respecting the small decisions that make a big difference towards the good and bad of this discipline. In each post I’m going to focus on just one small matter – a singular good or bad design choice – as demonstrated by a sample project. Each project may have many effective and ineffective aspects, but I’m just commenting on one.
The ‘little’ of this next design concerns, ironically, a method of showing how big something is by showing it exceeding the available screen space. The visualisation comes from The Guardian in an article about ‘Bezos’s empire: how Amazon became the world’s most valuable retailer‘.
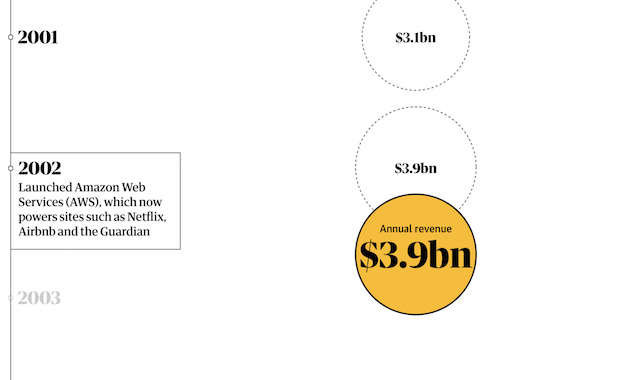
The basis of the visual is a vertical scroller that steps you through Amazon’s annual revenues generated yearly since 1996. As you scroll down the page, the bubbles grow proportionately with the growing revenue, starting off with the smallest of $15.7m. Year by year the bubbles grow until a critical ‘visual’ point is reached around 2013 and through to the most recent value at 2017. As you see below, the value size is now such that the bubble size transcends the available vertical space of the chart canvas and screen dimensions.
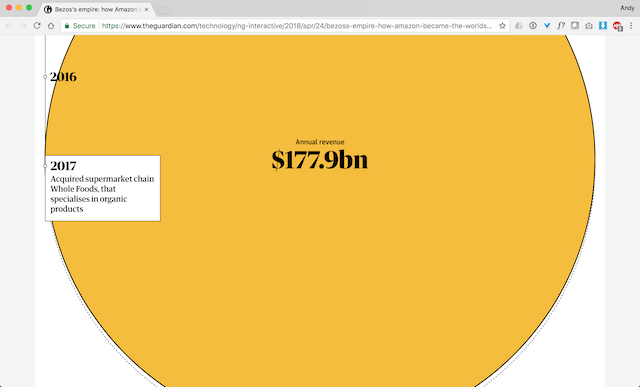
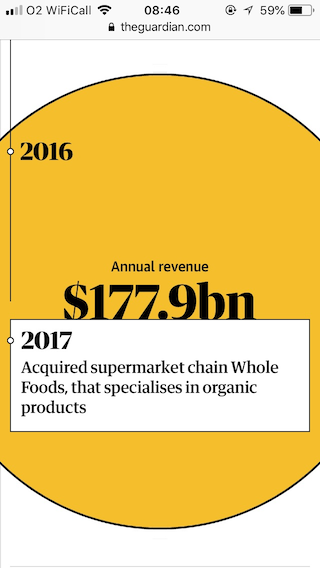
I’m viewing this page on a laptop but, as you see below, the same effect is seen on the mobile version, now with horizontal space restrictions from the portrait view in contrast to the vertical limits of a landscape laptop window. What we’re seeing here is a subtle but clever narrative device that essentially says ‘this value is now so ridiculously large that you no longer need to concern yourself with trying to perceive its size, just see it as being big, so big it fails to fit in your screen’. The value label is there if you want to know the actual magnitude but otherwise ‘the gist’ of these latter numbers being extremely large is sufficient for the point being made.