
This is part of a series of posts about the ‘little of visualisation design’, respecting the small decisions that make a big difference towards the good and bad of this discipline. In each post I’m going to focus on just one small matter – a singular good or bad design choice – as demonstrated by a sample project. Each project may have many effective and ineffective aspects, but I’m just commenting on one.
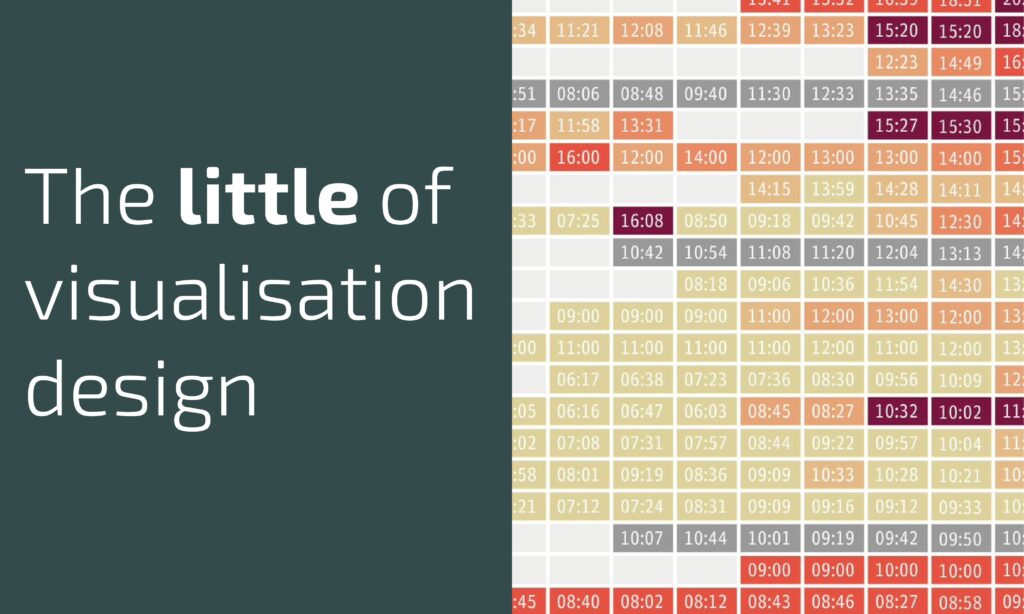
The ‘little’ of this next design concerns the careful balanced design of value labels. The piece in focus was produced by Ashley Kirk for The Telegraph in an article about police response times (preview here if you’re not registered).
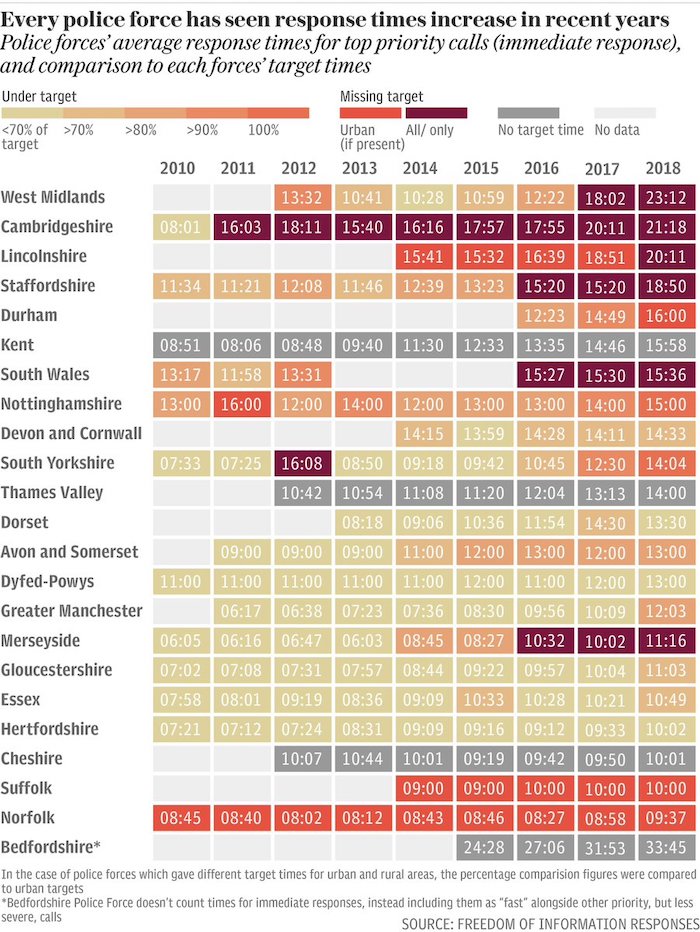
The heat map reveals patterns of average response times to emergency calls for police forces across England and Wales over several years. The colour scheme shows the darker shades edging towards or exceeding target.
What particularly struck me when I first looked at this piece was an appreciation for the careful thought that would have gone into seeking the right balance in the visibility/prominence of the value labels within the chart, especially in contrast to the cell colour encoding. Designing the presentation of text annotations – titles and intros, captions, axis labels, value labels – is an intricate matter involving typeface, font style, font size and colour decisions.
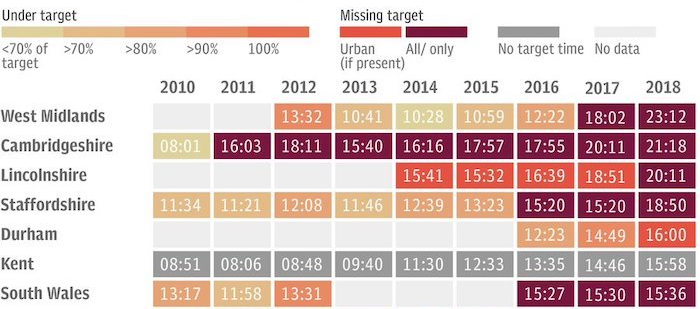
By making the value labels white (and possibly with some slight opacity, though that could be an illusion), you can see the labels when you want to see them but they don’t shout. Or, more to the fact, only the important ones are shouting – the values within the darker cells that represent perhaps the most important values of longer response times. A grey shade couldn’t be used as it was already committed to showing no data or no target, and black would have created more contrast for the least important values.
