
This is part of a series of posts about the ‘little of visualisation design’, respecting the small decisions that make a big difference towards the good and bad of this discipline. In each post I’m going to focus on just one small matter – a singular good or bad design choice – as demonstrated by a sample project. Each project may have many effective and ineffective aspects, but I’m just commenting on one.
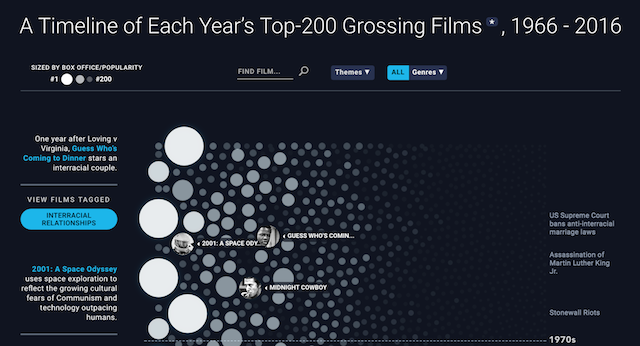
The ‘little’ of this next design concerns the confidence to almost hide data items of lower value and relevance. The project in question comes from The Pudding and is titled ‘Analyzing plot trends for every top-grossing film from the past 50 years‘ based on analysis from millions of user-submitted keywords describing a film’s plot to find cultural themes across the top 200 films over this period.
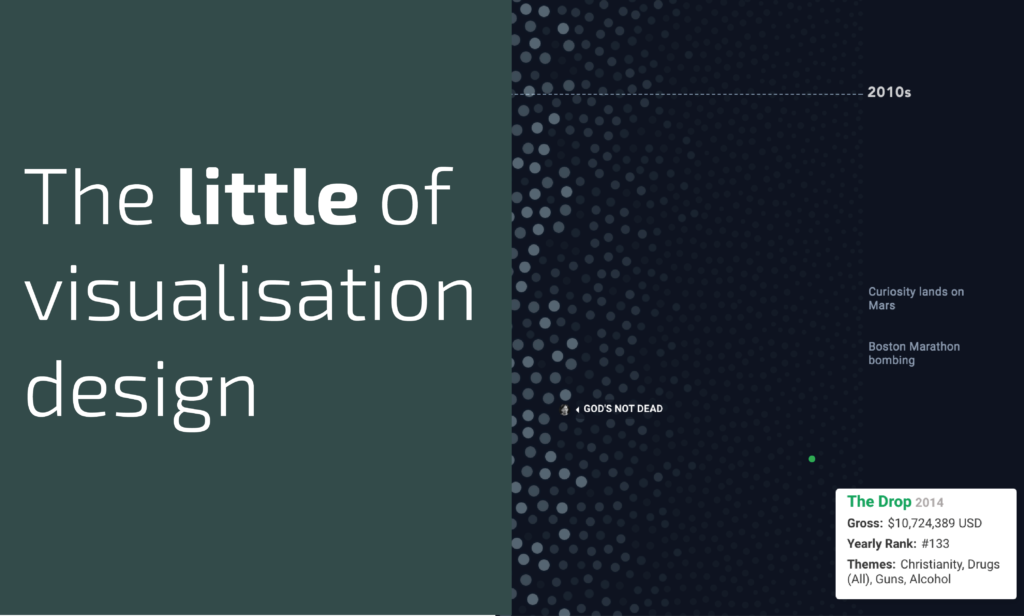
One of the subtle features that struck me this work is the way the small values – the bubbles for those lower grossing films within each year’s top 200 movies – are barely visible in both size but, more consciously, through the camouflaging of their foreground colour with the background. In the screen grab below you see ‘The Drop’ is present in the analysis but relatively incidental.
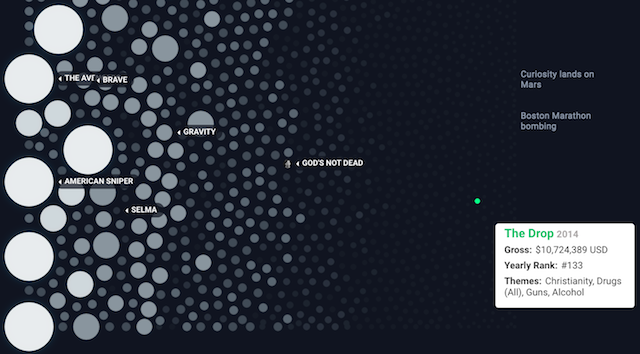
In diminishing the colour contrast of these small values, fading them to nothingness, it demonstrates a certain audacity: we will include all values for completeness and consistency but readers need not expend much perceptual effort contending with less important items.
