
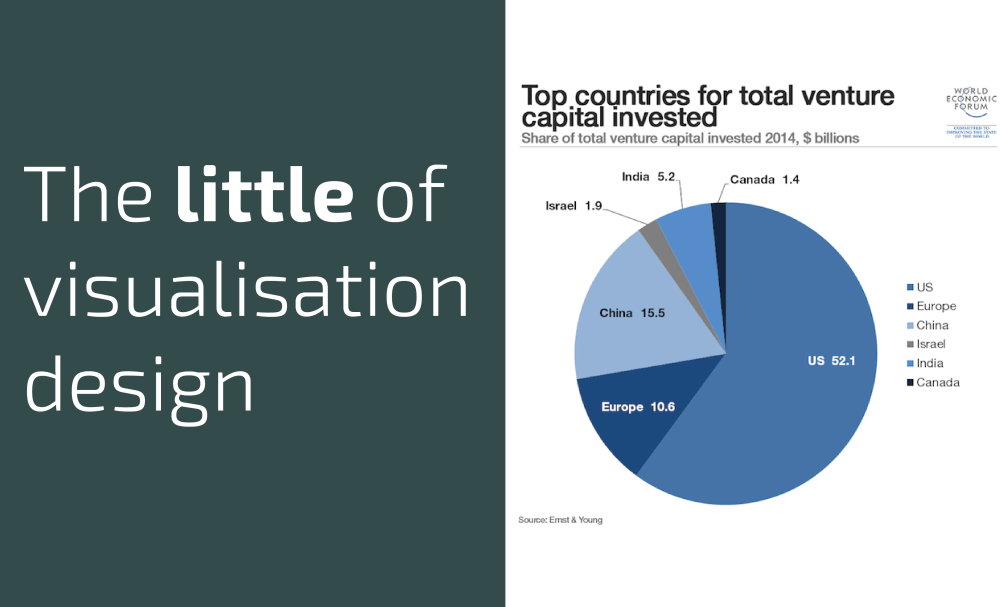
This is part of a series of posts about the ‘little of visualisation design’, respecting the small decisions that make a big difference towards the good and bad of this discipline. In each post I’m going to focus on just one small matter – a singular good or bad design choice – as demonstrated by a sample project. Each project may have many effective and ineffective aspects, but I’m just commenting on one.
Perhaps inevitably, I begin this series looking at a pie chart (side note: don’t blame the pie chart on bad design choices). More specifically the issue here concerns unnecessary duplicate labelling.
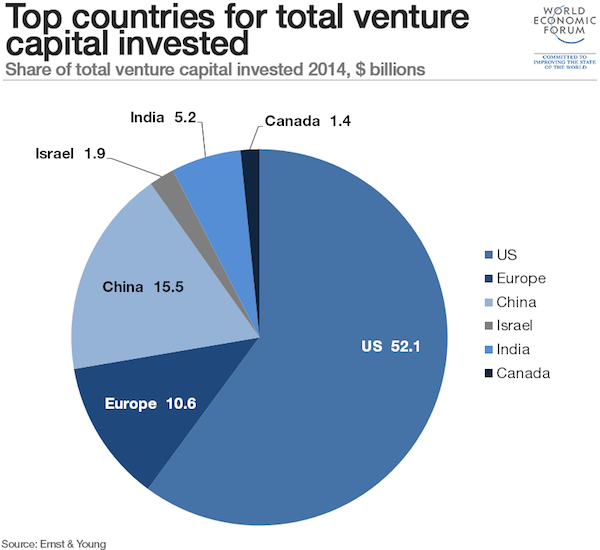
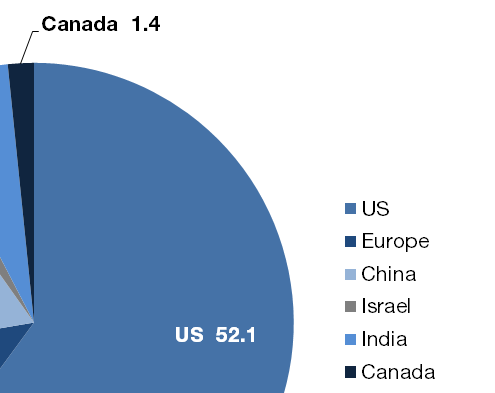
In this example, from the WEF, you see the use of colour legend AND direct labelling to indicate the categories that make up the parts of the whole. You don’t need both. Either directly label or don’t. In this case, due to the colour choices being far too similar, the direct labelling is the better option, which makes the legend entirely redundant.
(Found via a tweet from Nigel Hawtin)
