
Podcast
Explore Explain S2 E5: Giorgia Lupi
I’m delighted to launch the second season of Explore Explain, a long-form video and podcast series about data visualisation design. For episode five it was a pleasure to welcome Giorgia Lupi.

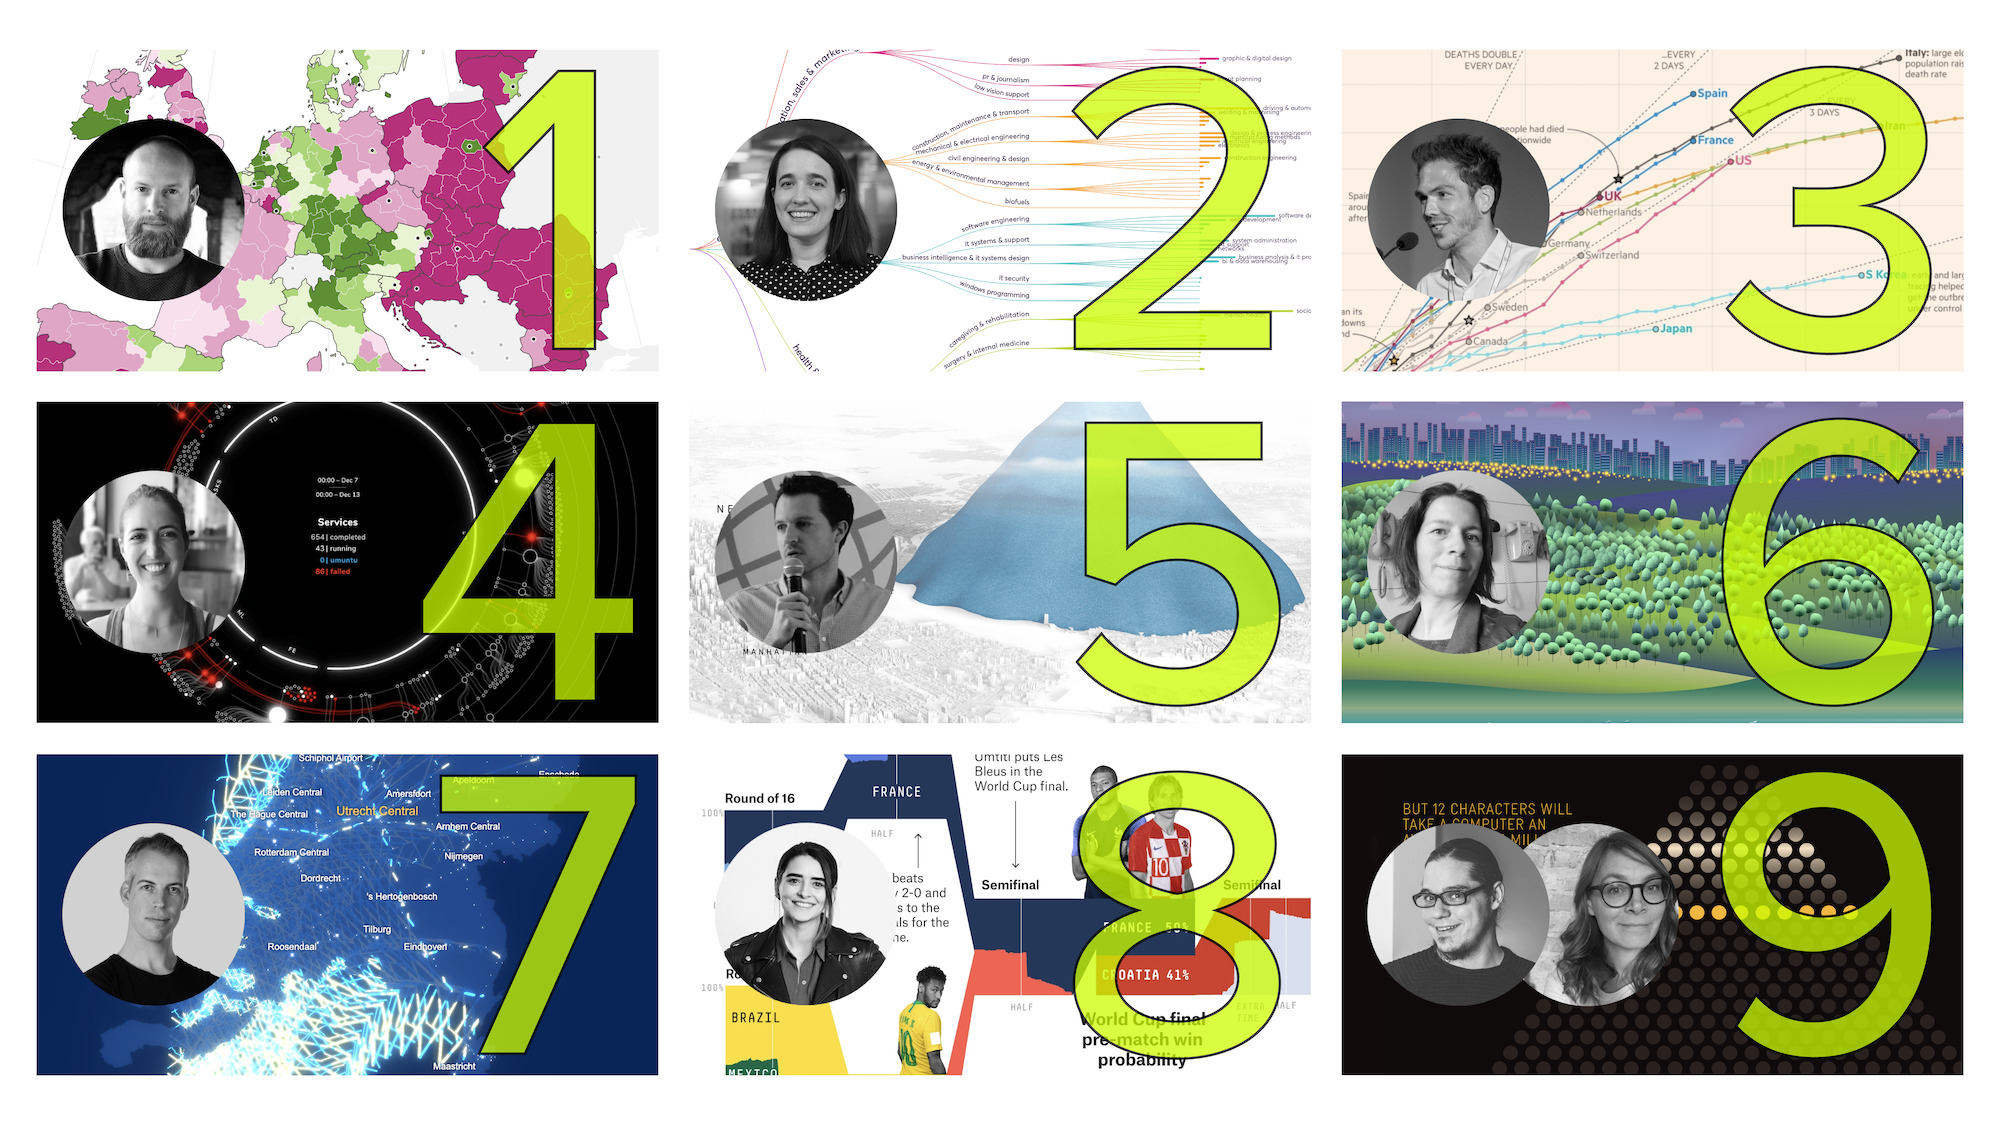
I’m delighted to launch the second season of Explore Explain, a long-form video and podcast series about data visualisation design. For episode five it was a pleasure to welcome Giorgia Lupi.

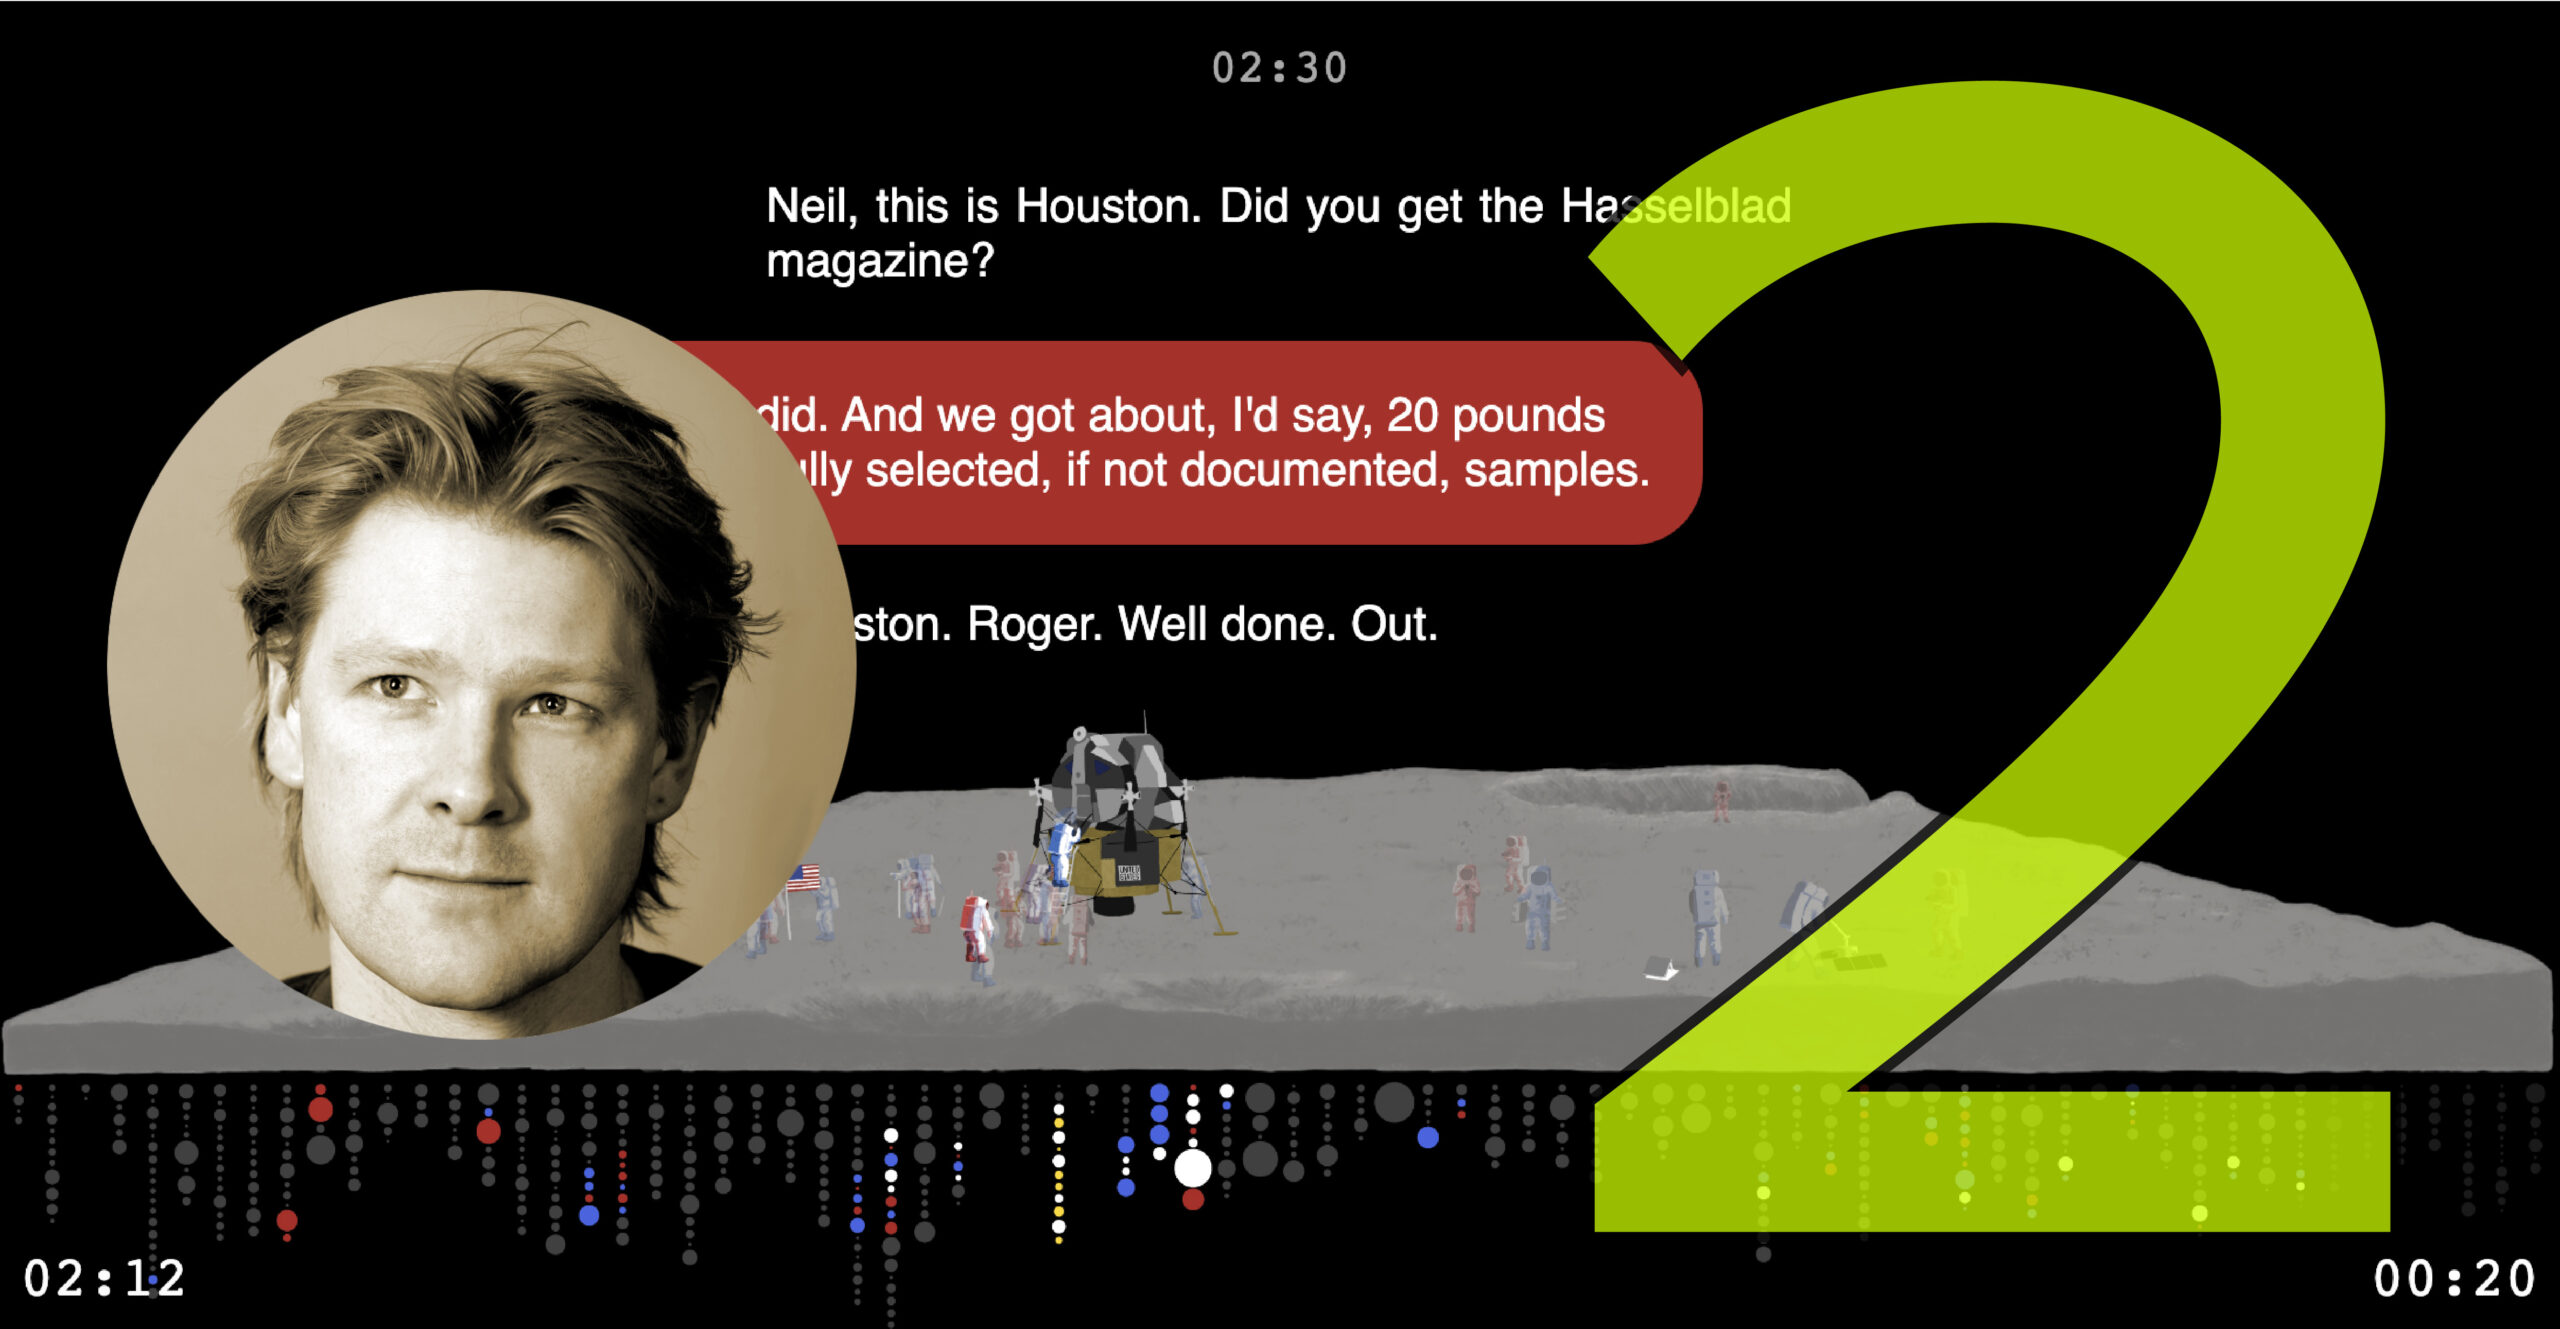
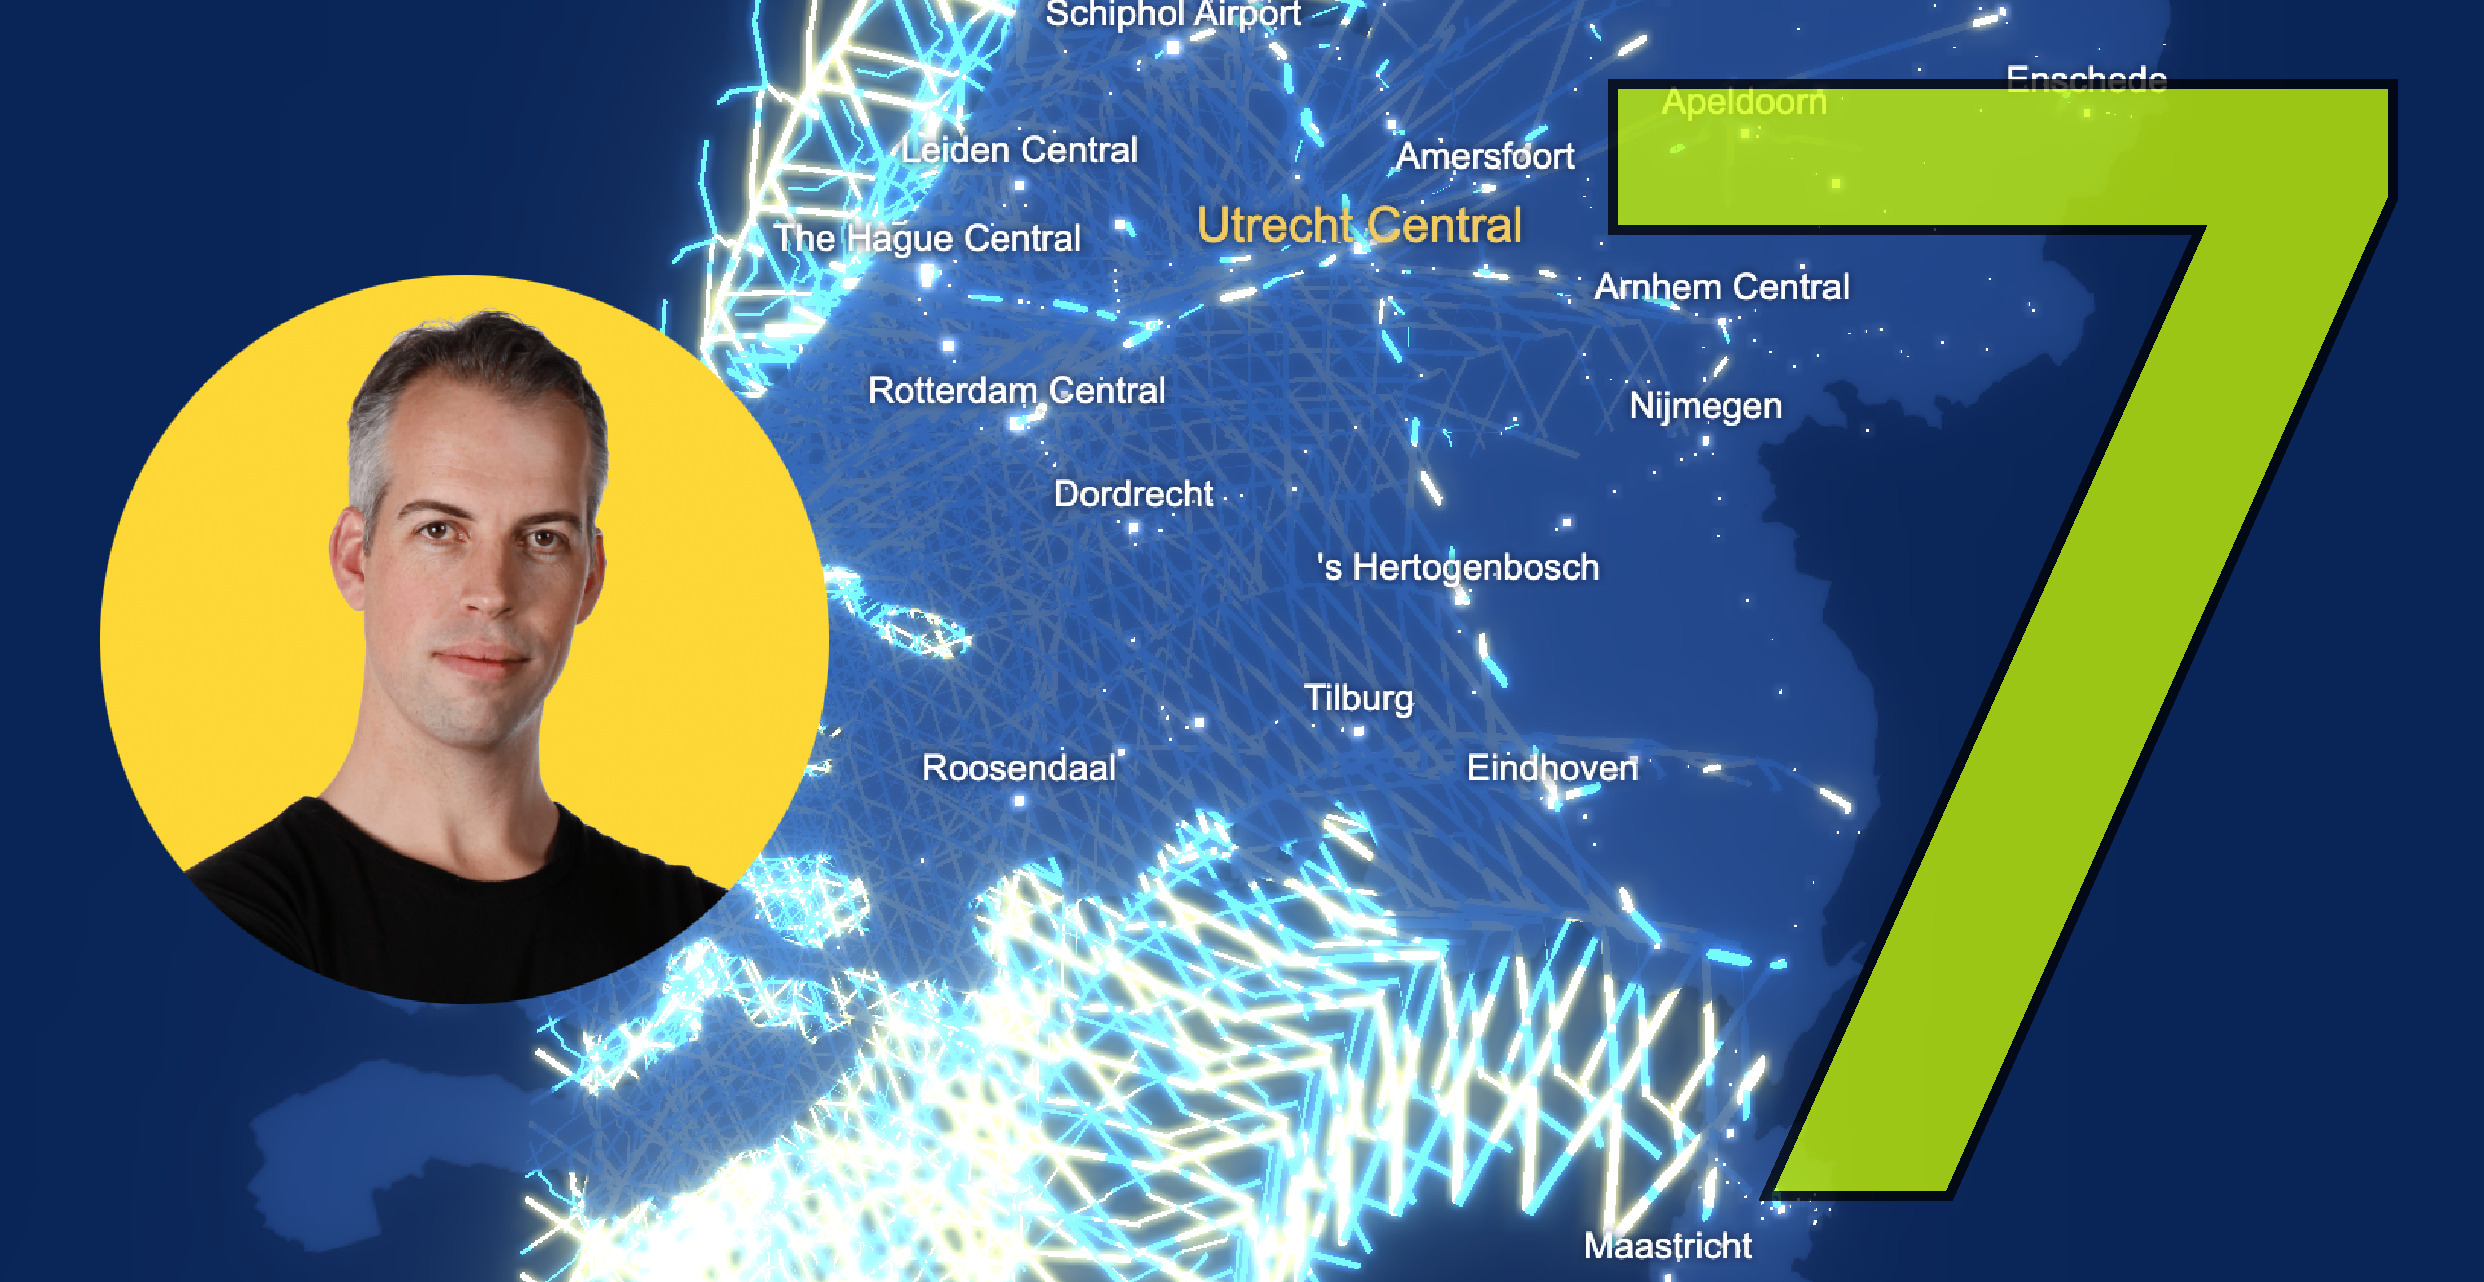
I’m delighted to launch the second season of Explore Explain, a long-form video and podcast series about data visualisation design. For episode four it was a pleasure to welcome Tom Worville.
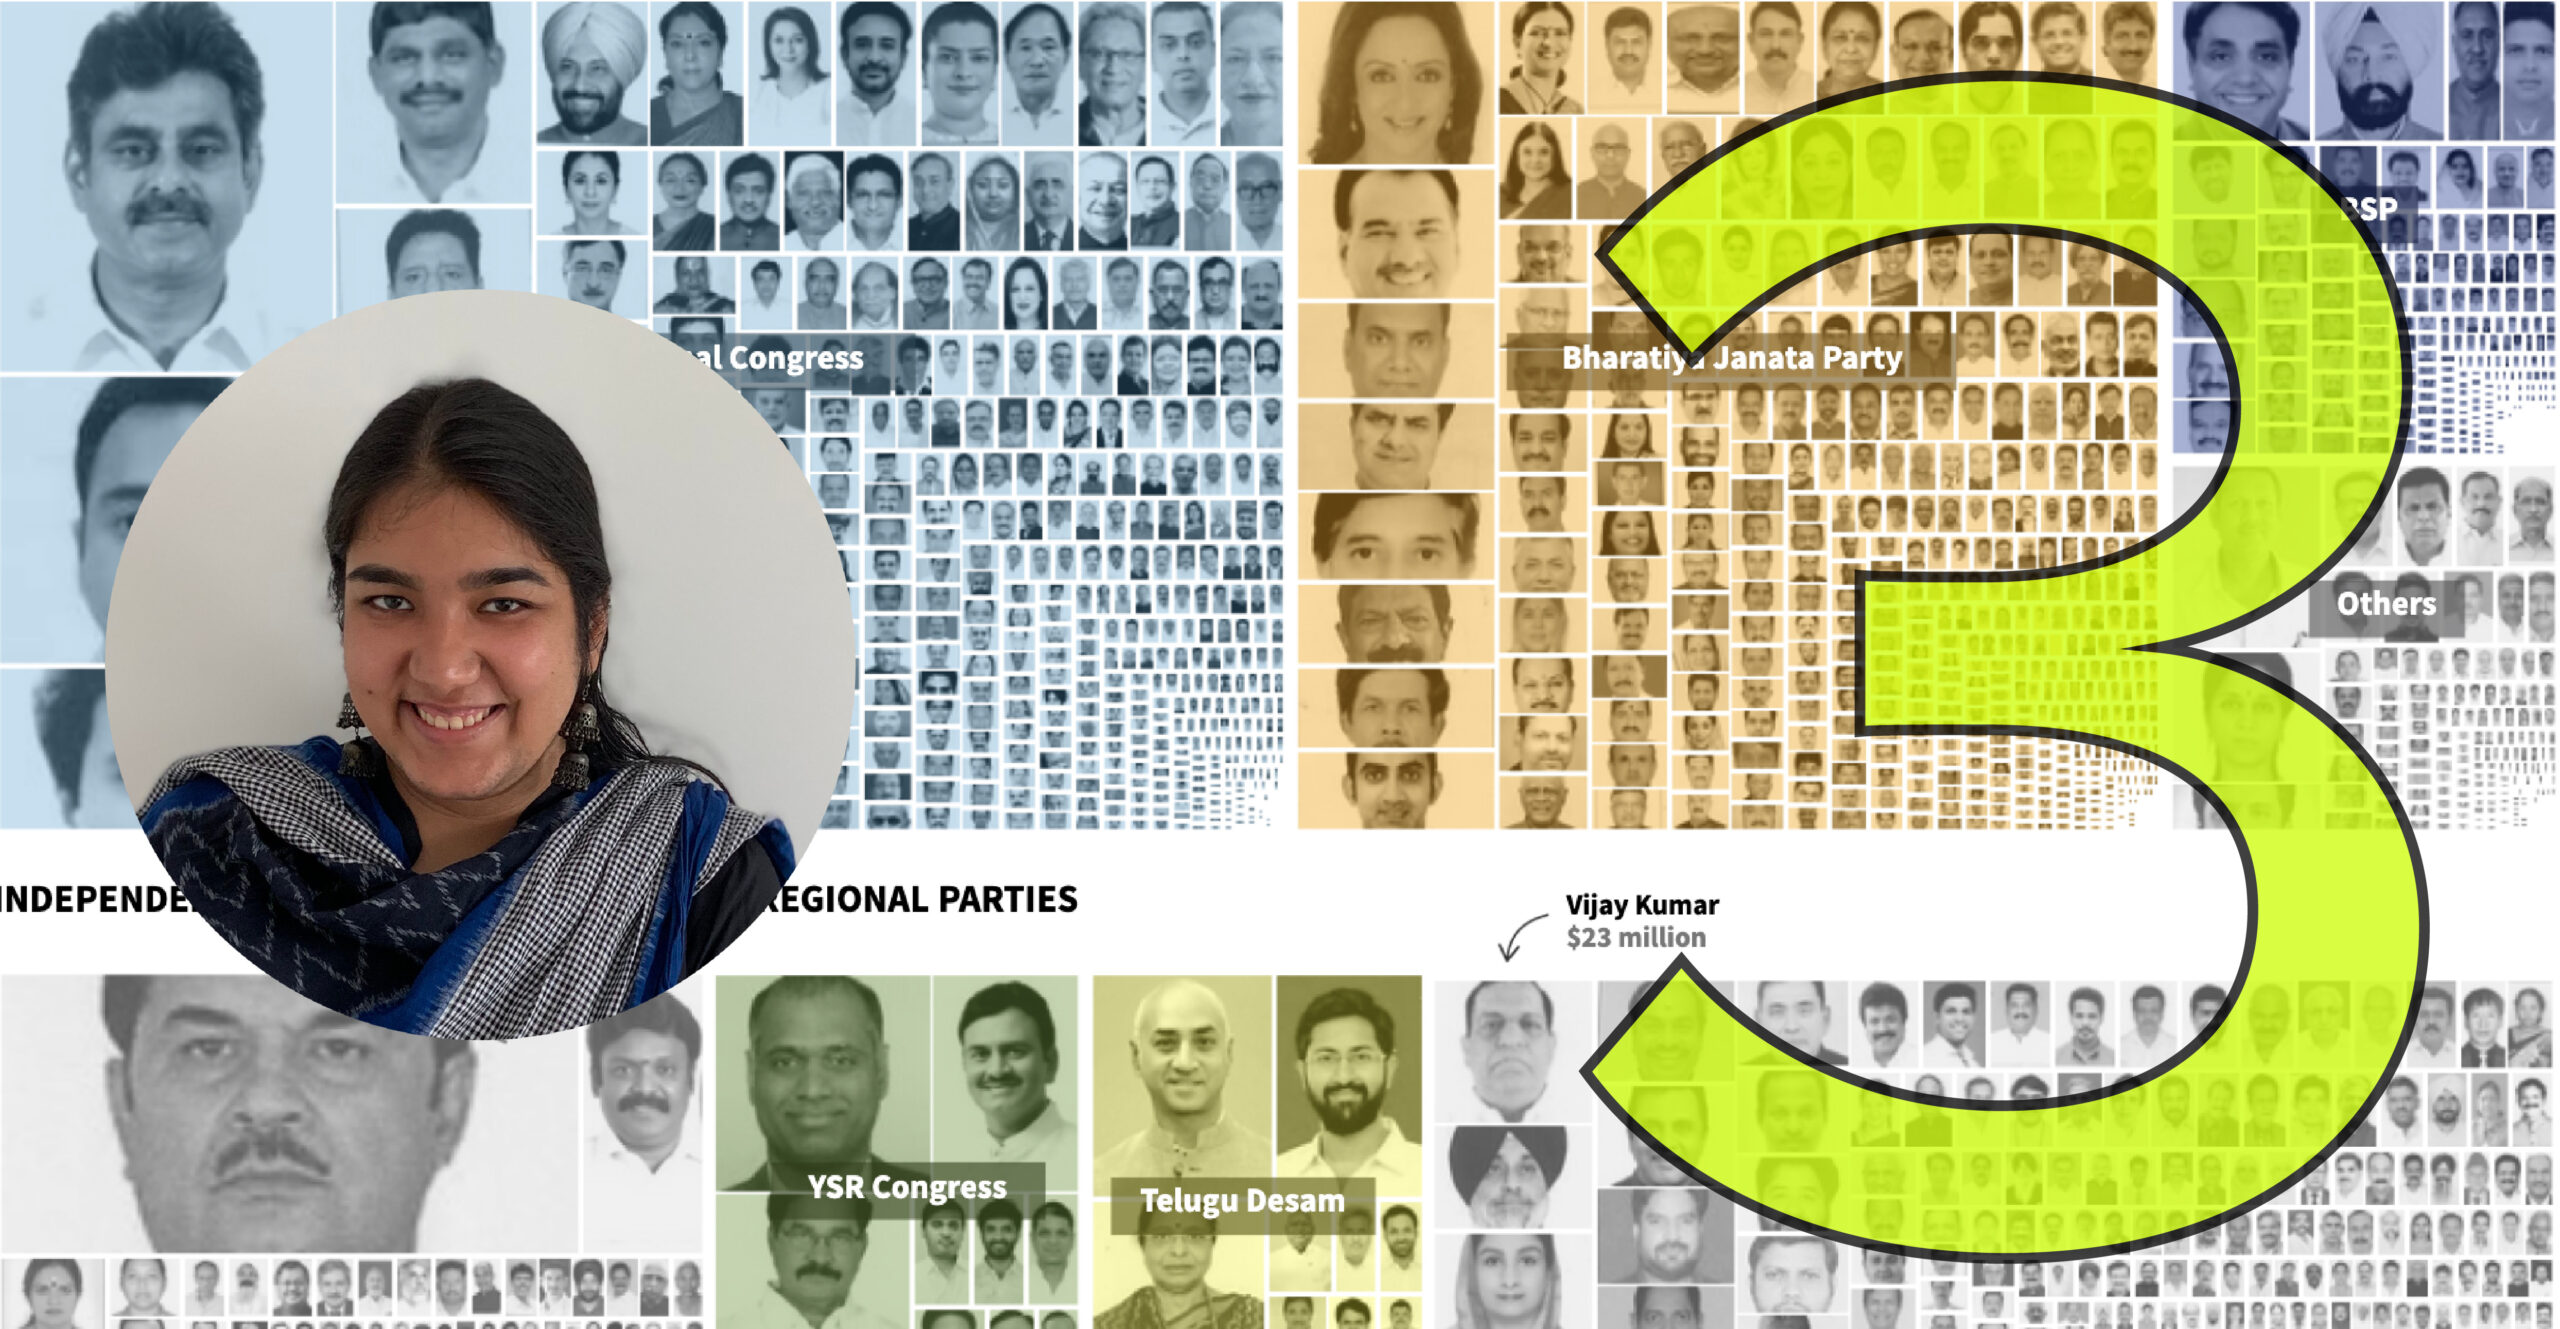
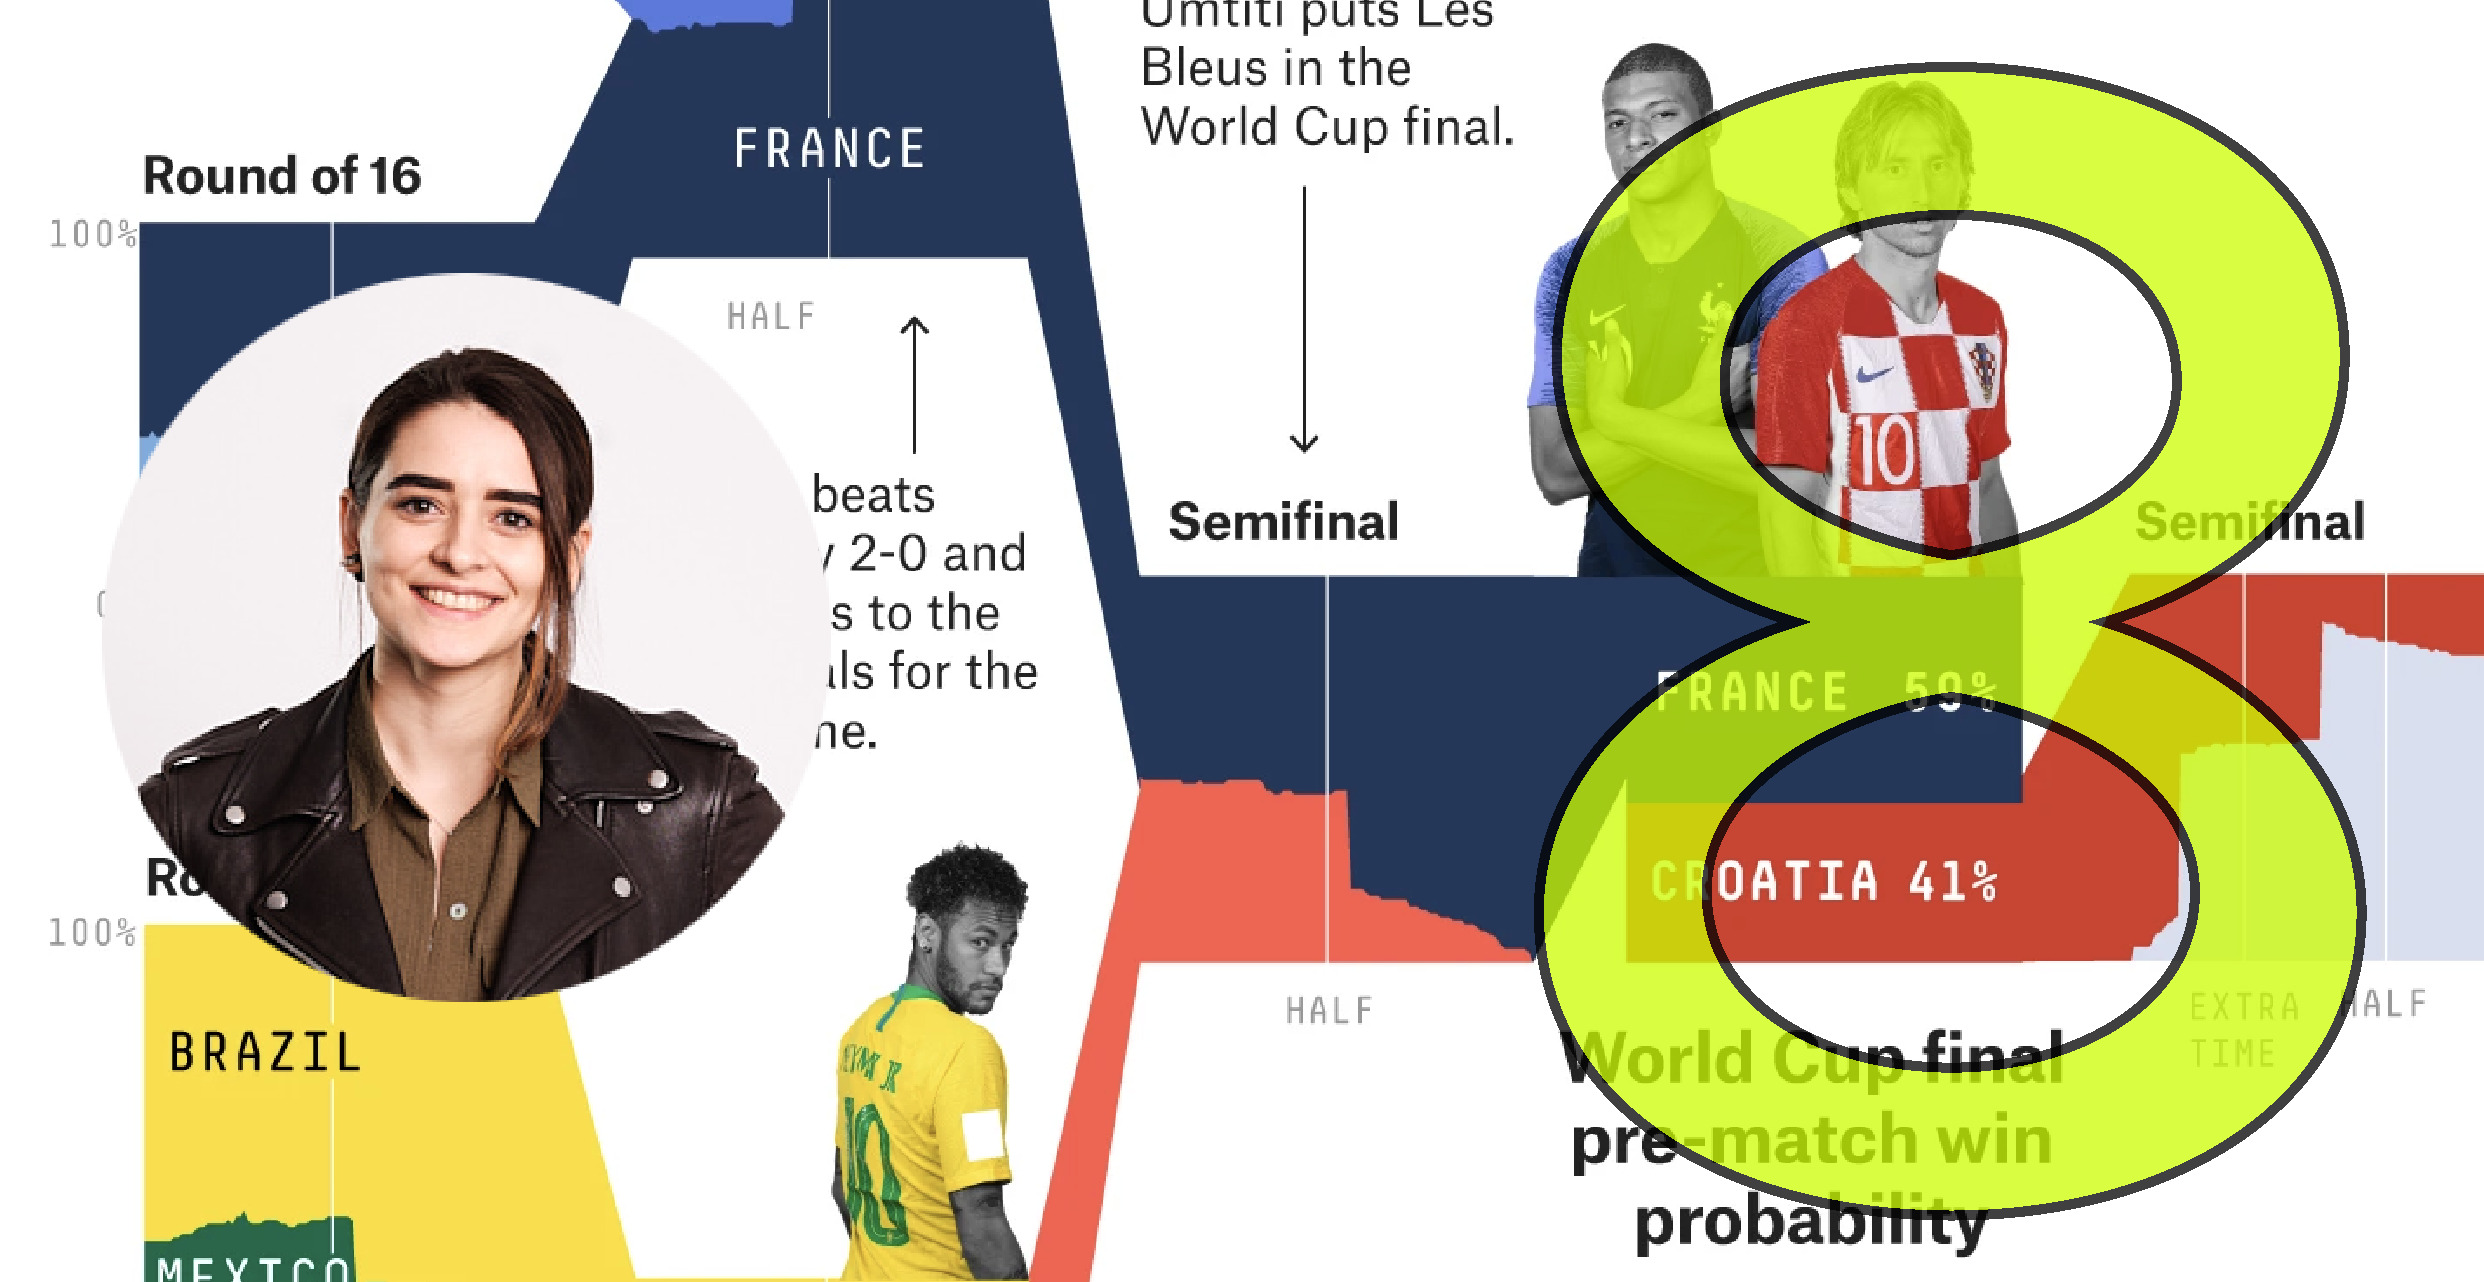
I’m delighted to launch the second season of Explore Explain, a long-form video and podcast series about data visualisation design. For episode three it was a pleasure to welcome Gurman Bhatia.
This is a belated announcement to share some exciting news (for me) that my book has won an award! Last week my book won CILIP’s ‘K&IM Information Resource Award’ for a printed publication.
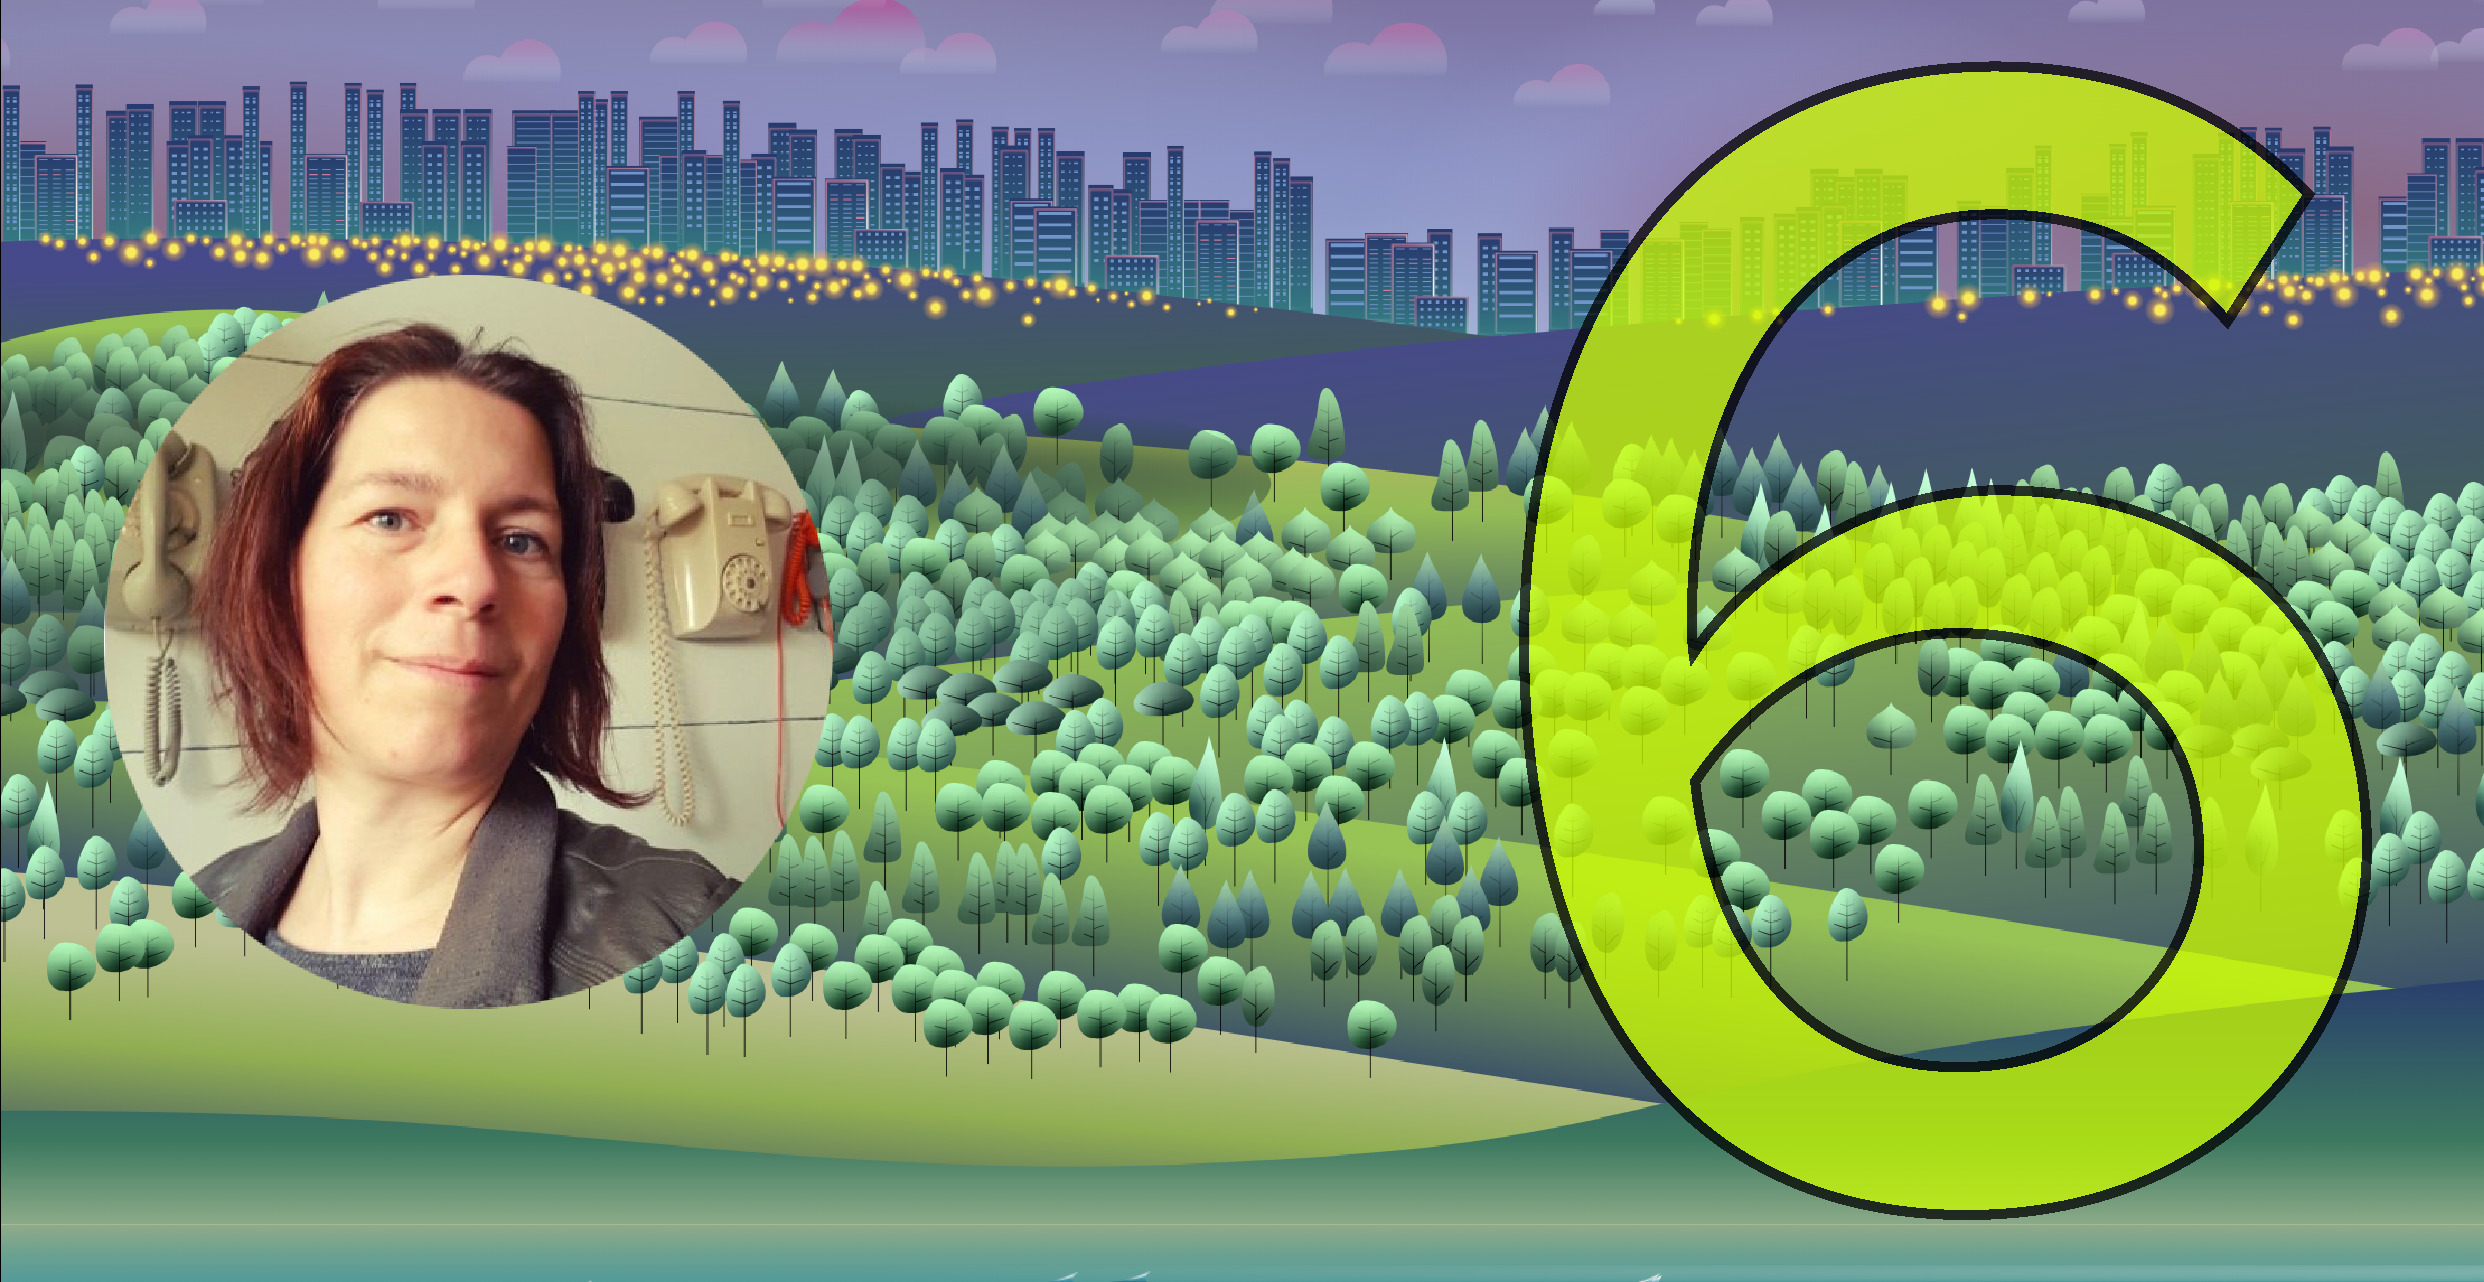
I’m delighted to launch the second season of Explore Explain, a long-form video and podcast series about data visualisation design. For episode two it was a pleasure to welcome RJ Andrews.

At the end of each month I pull together a collection of links to some of the most relevant, interesting or thought-provoking web content I’ve come across during the previous month. Here’s the latest collection from August 2020.
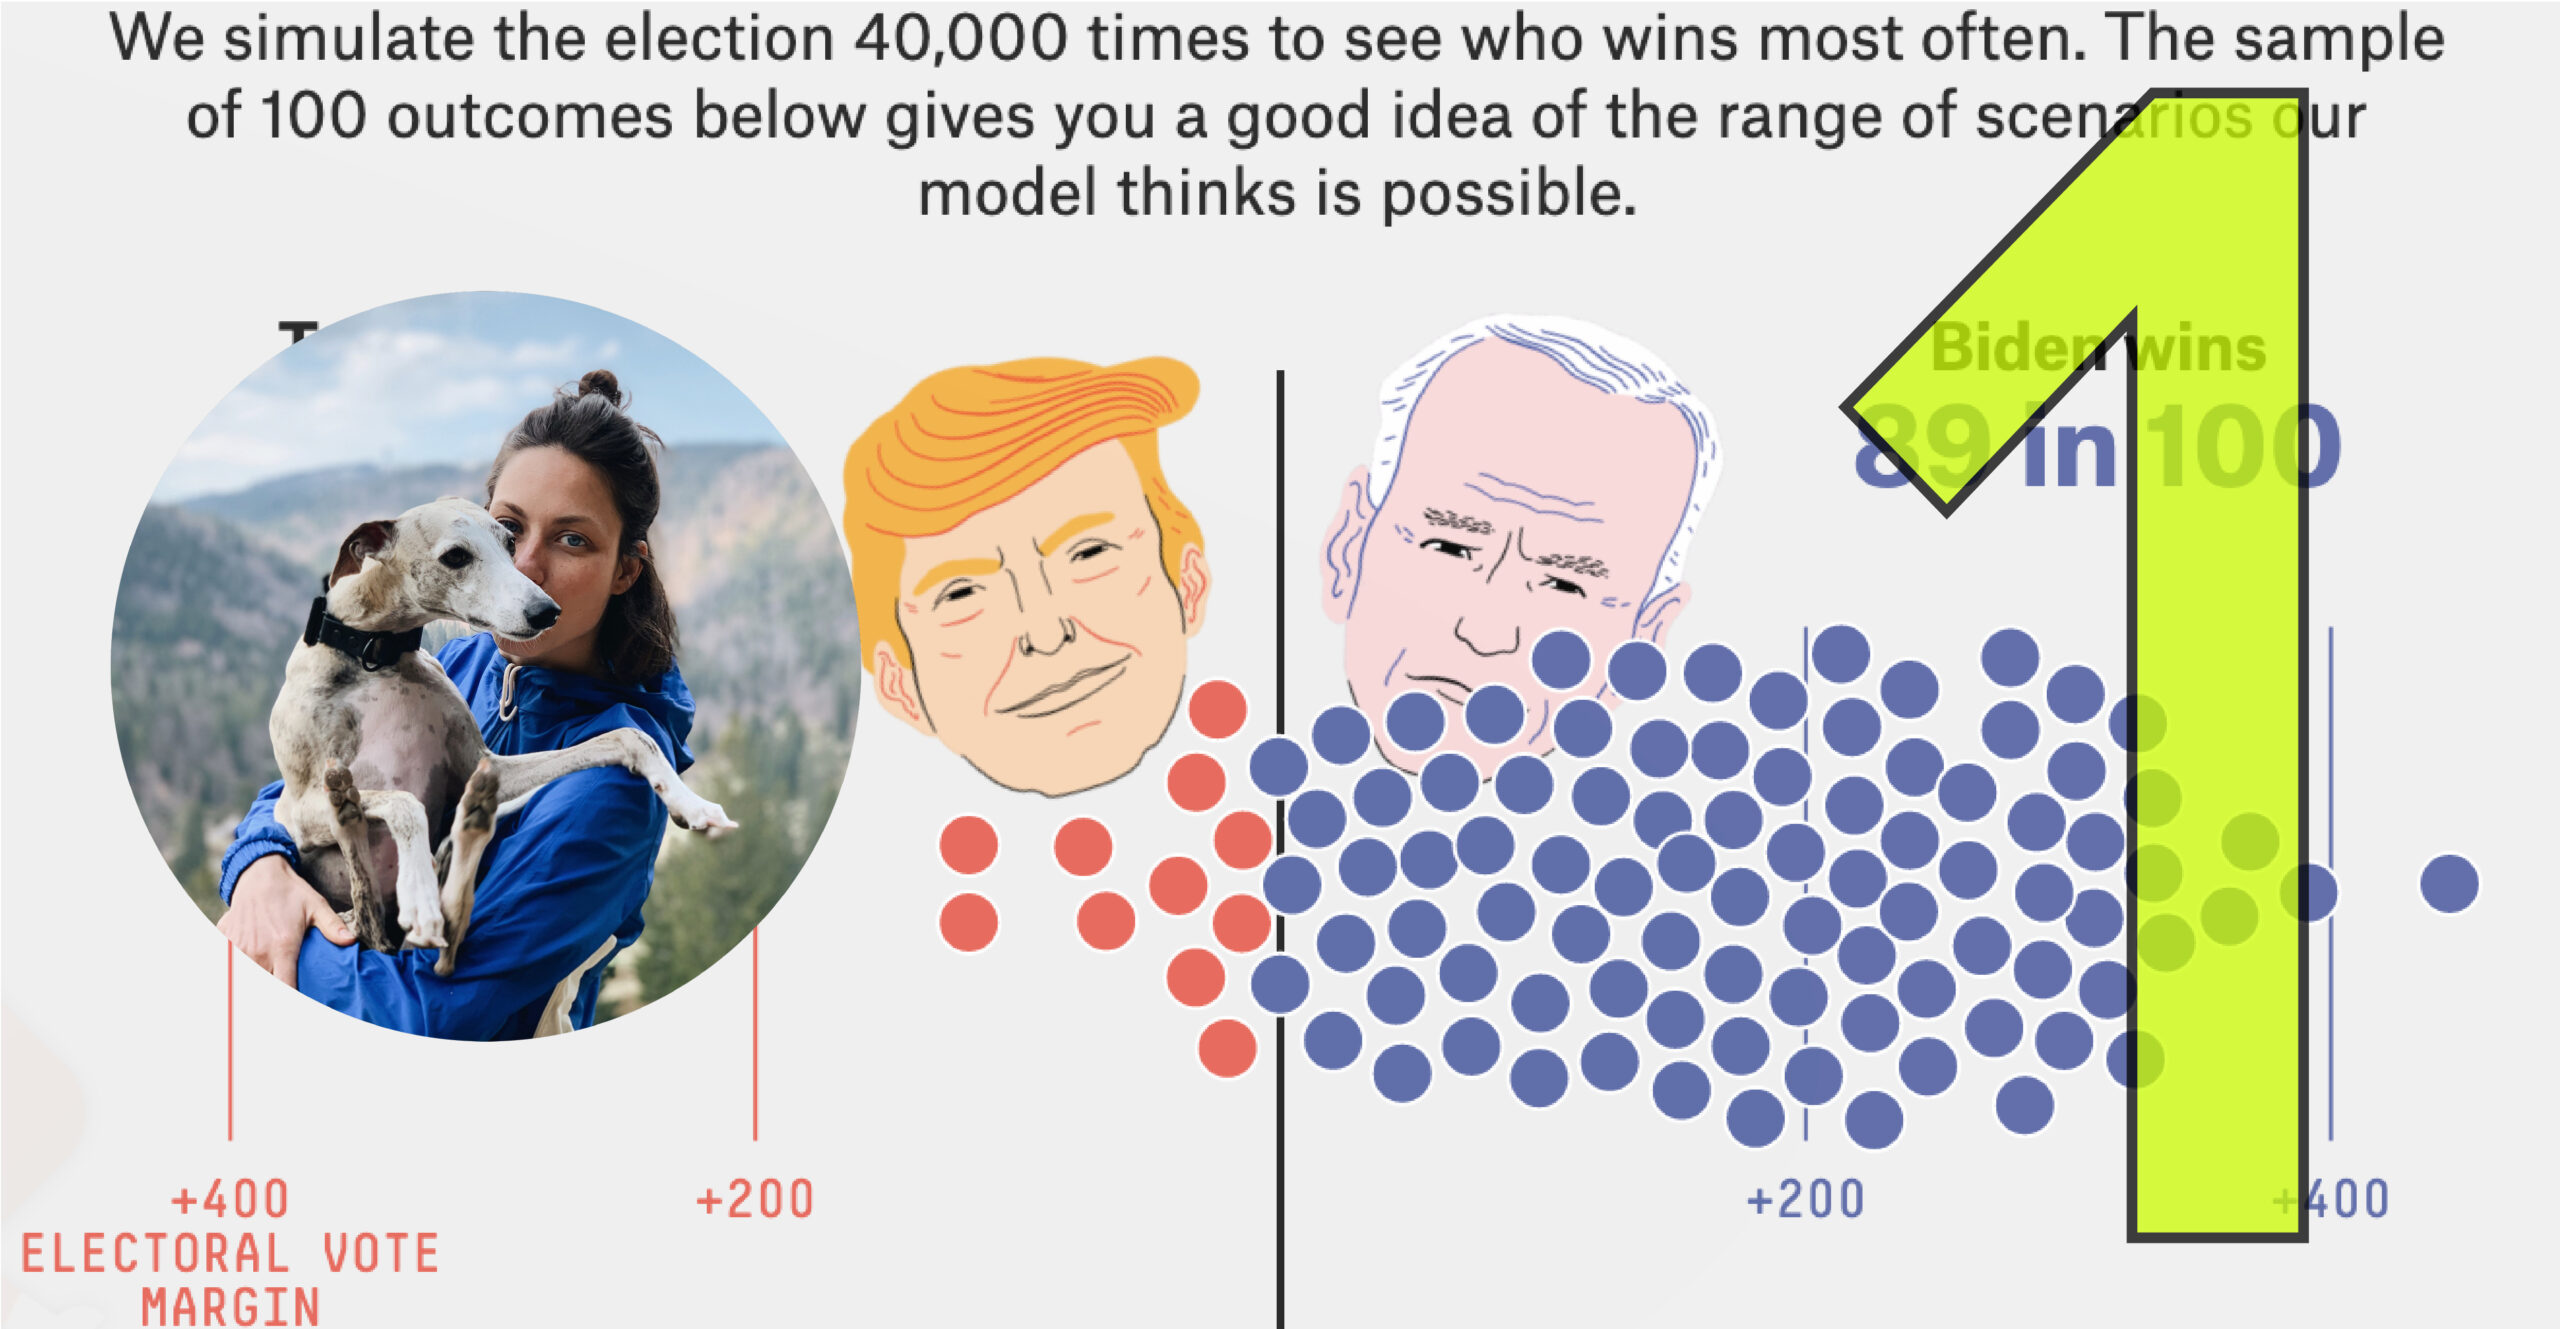
I’m delighted to launch the second season of Explore Explain, a long-form video and podcast series about data visualisation design. For episode one it was a pleasure to welcome Anna Wiederkehr.
At the end of each month I pull together a collection of links to some of the most relevant, interesting or thought-provoking web content I’ve come across during the previous month. Here’s the latest collection from July 2020.

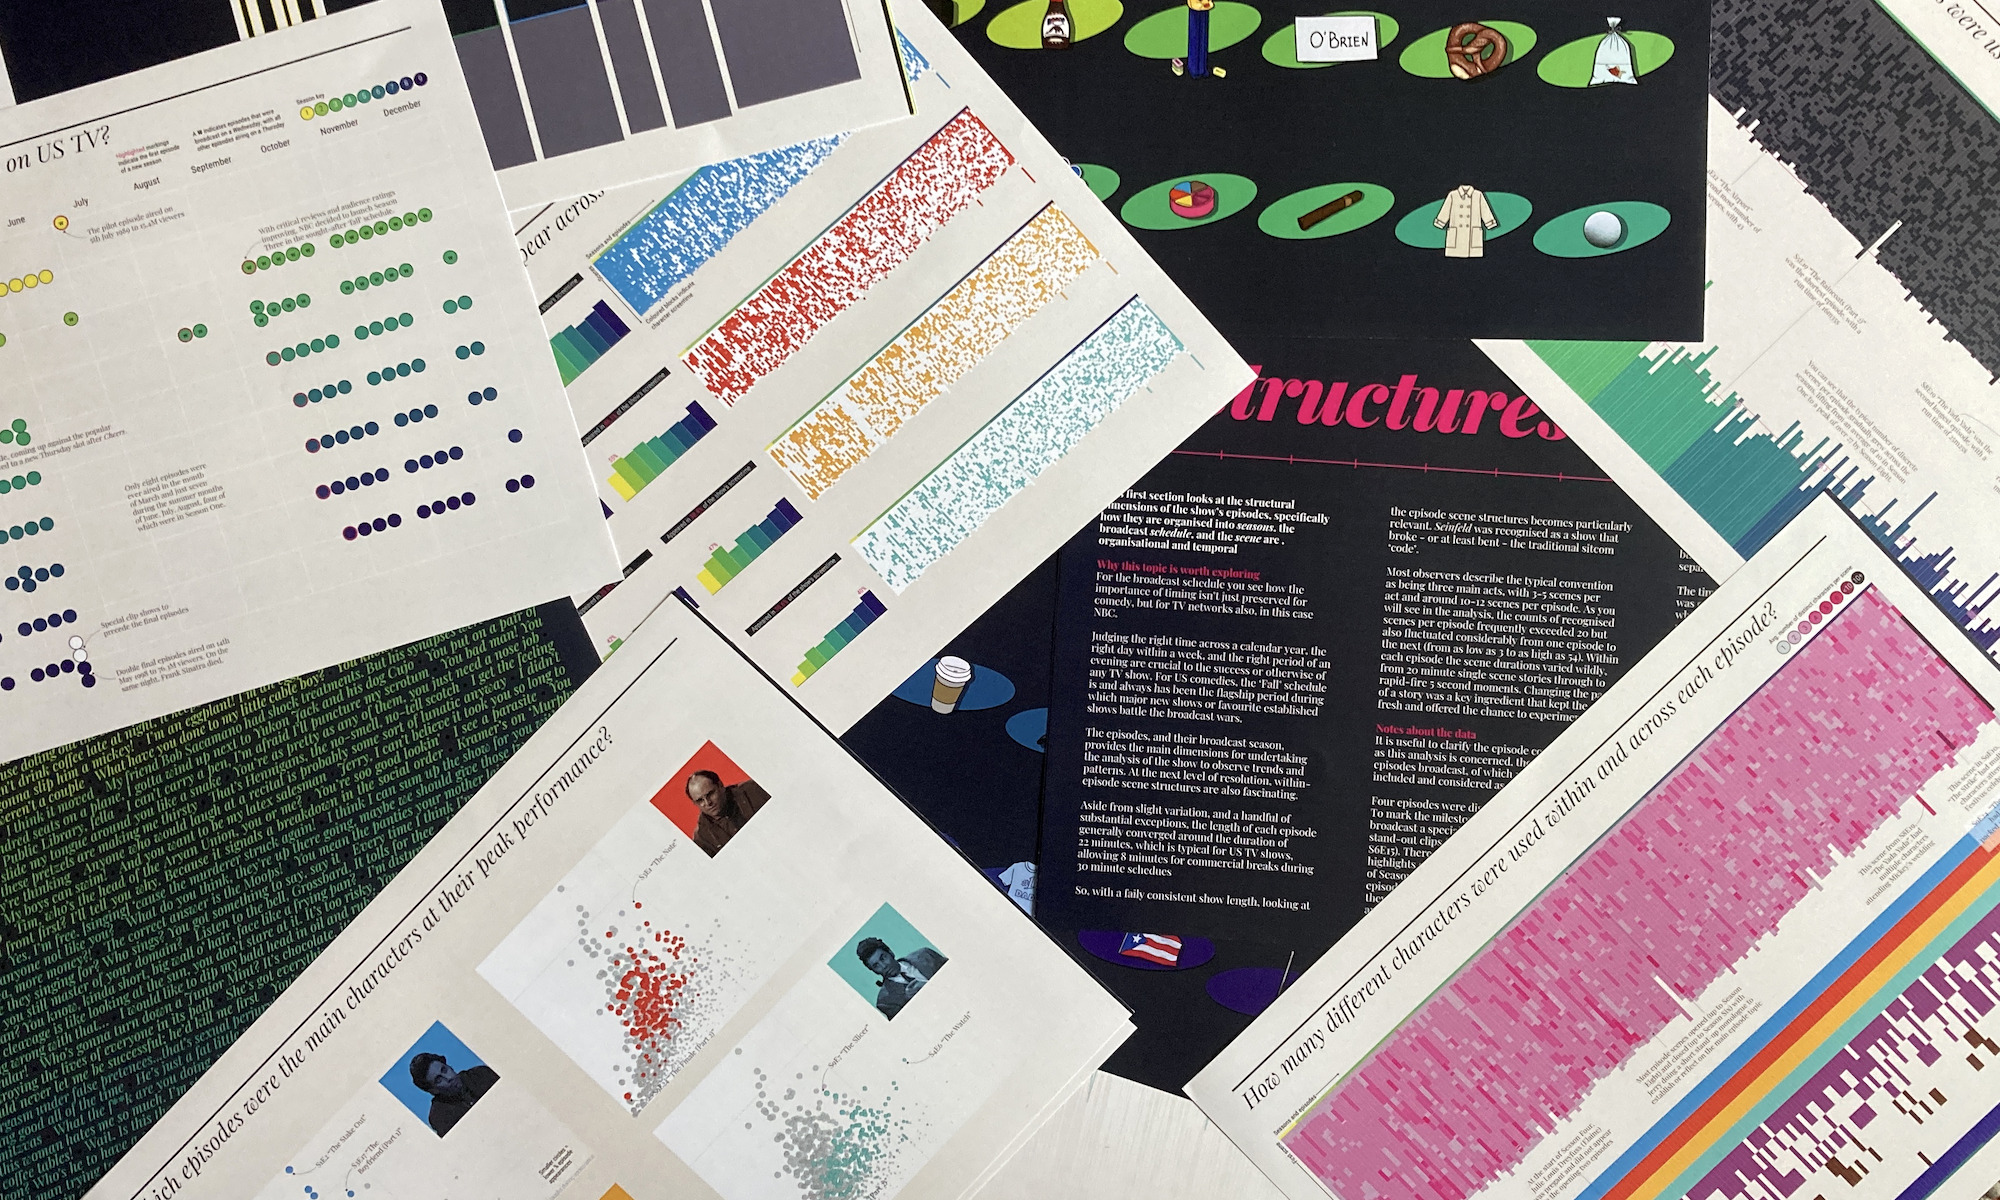
One month ago I took collection from my local printers of the hard copies of my new work ‘The Seinfeld Chronicles’, a passion project exploring the rhythm and texture of every episode of Seinfeld.
am about to resume work on my Explore Explain podcast and video series, with a second season of nine episodes. A big difference from Season One is that I have unfortunately lost the exceptional services of my long-time collaborator, Matt Knott, who has got himself a brilliant new job.
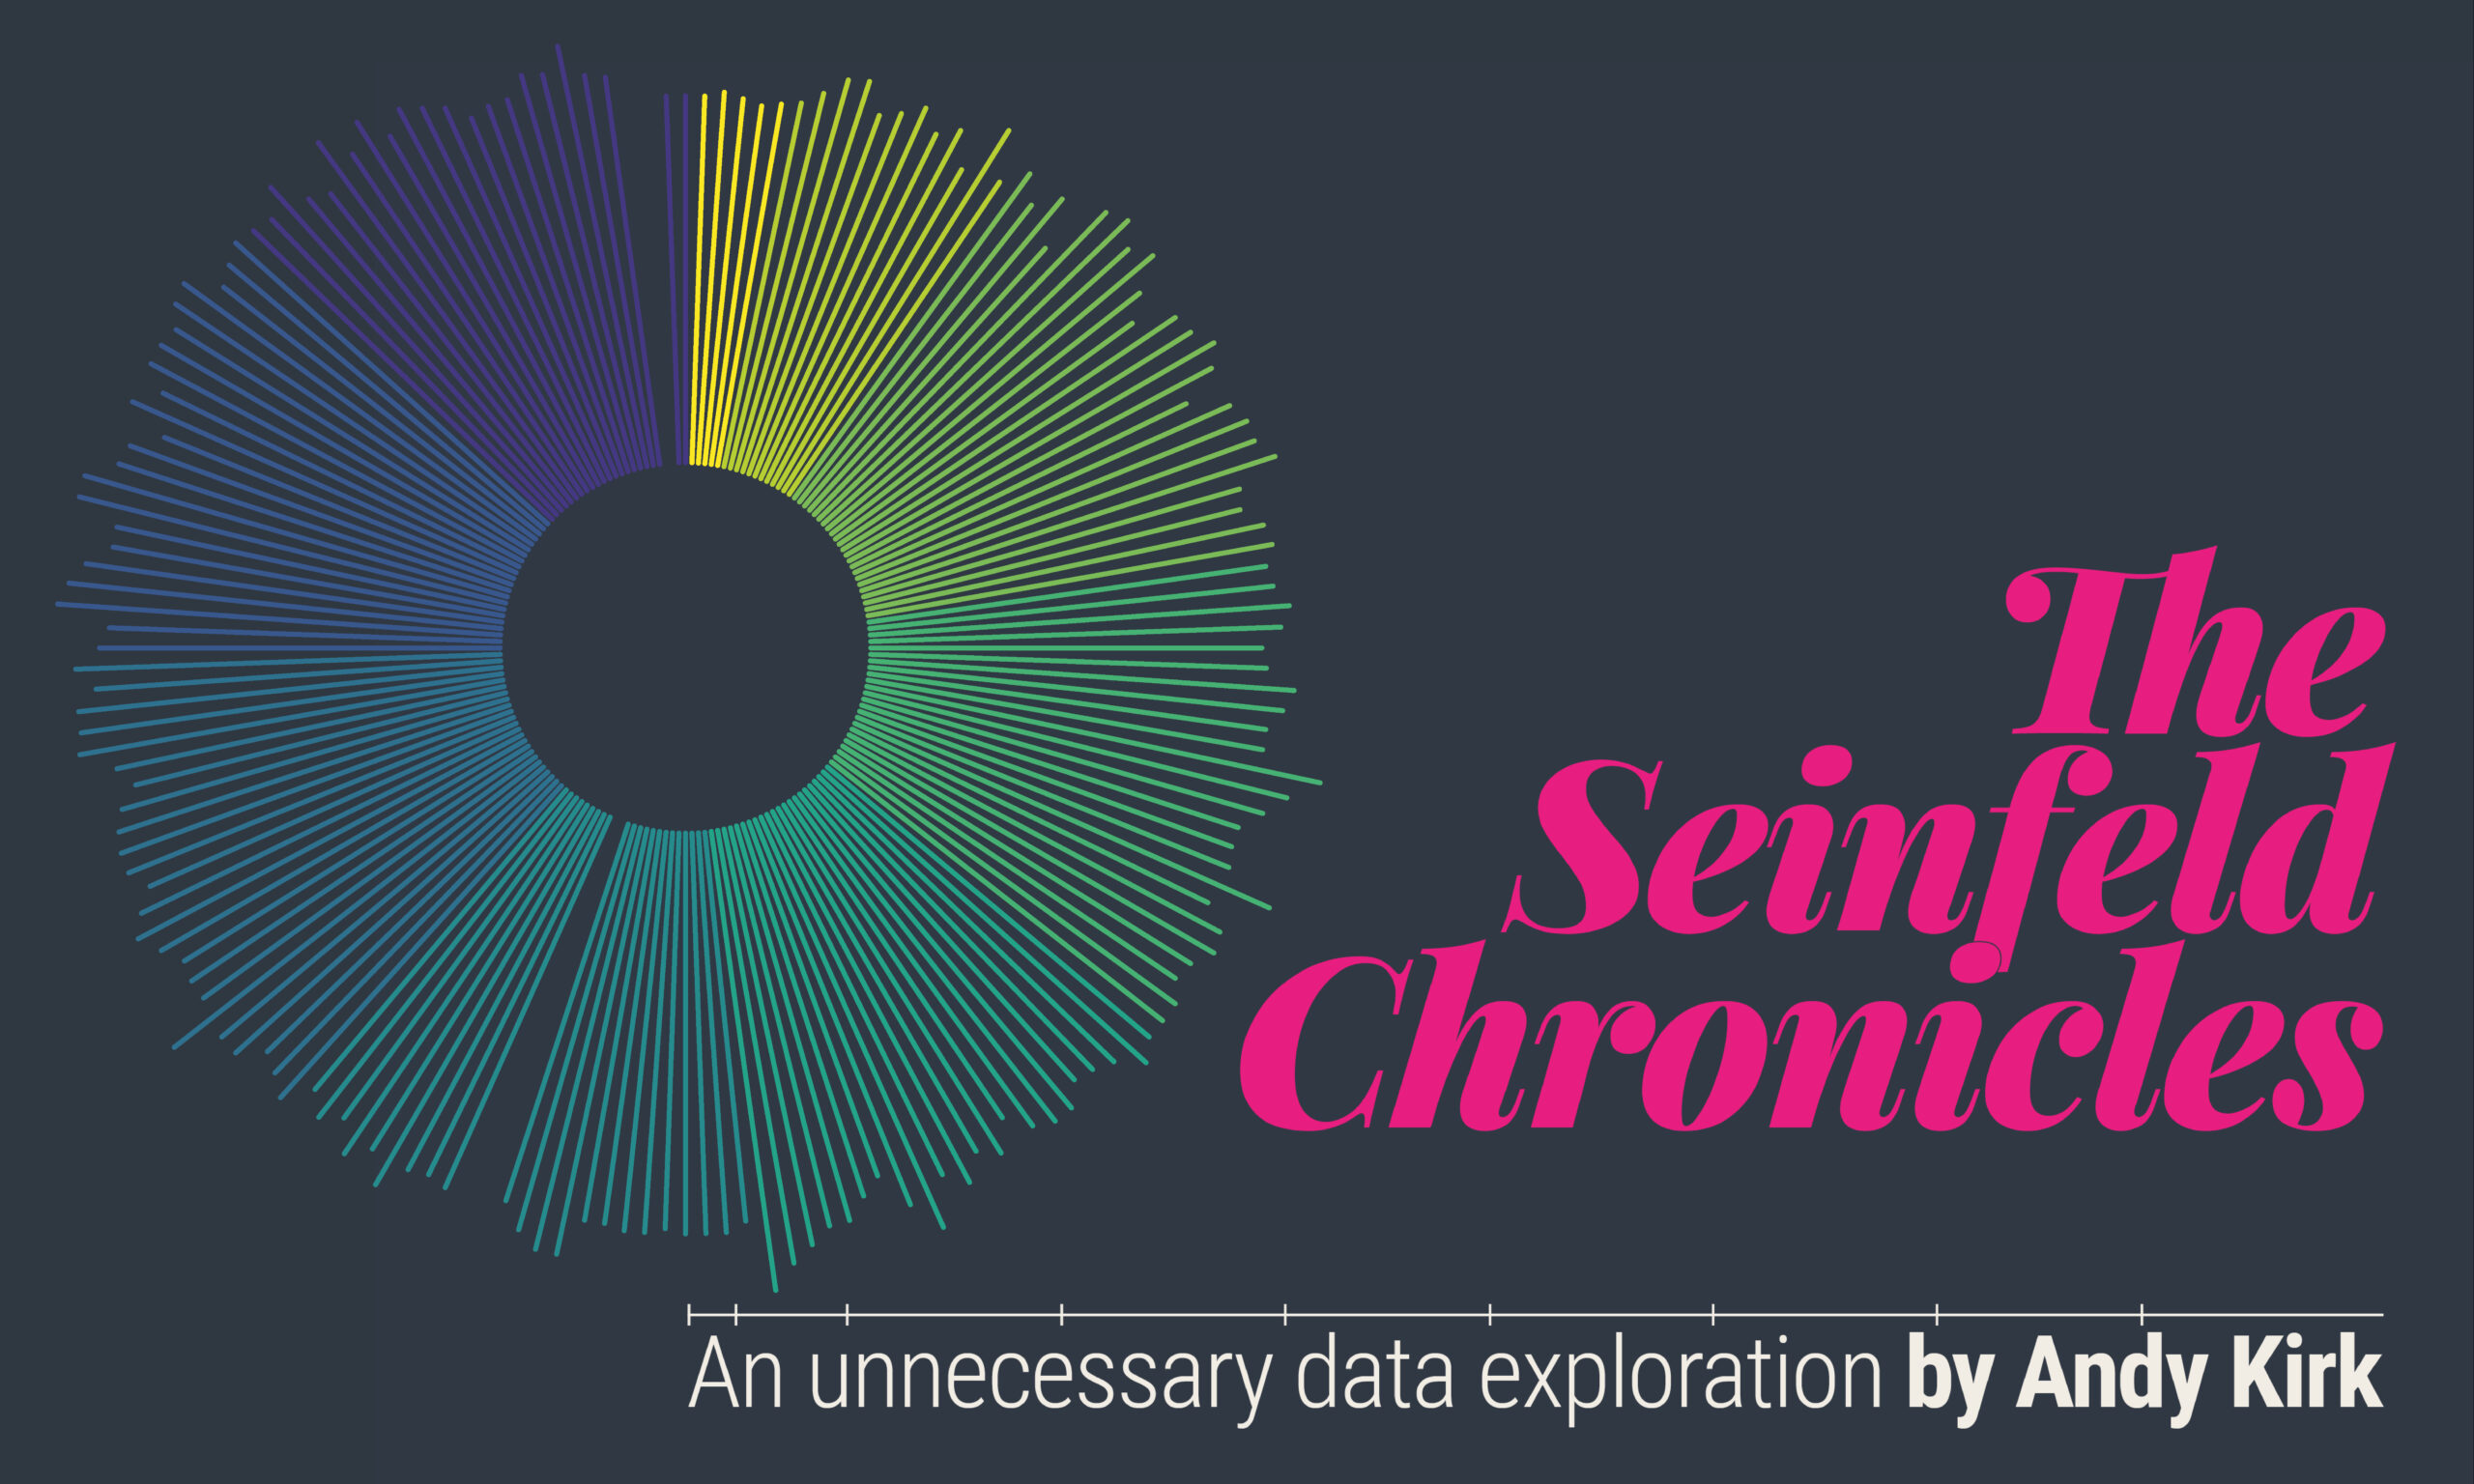
I am delighted to announce the completion, the unboxing, and finally now the launch of my new data visualisation project, The Seinfeld Chronicles, a book exploring the rhythm and texture of every episode of Seinfeld.
At the end of each month I pull together a collection of links to some of the most relevant, interesting or thought-provoking web content I’ve come across during the previous month. Here’s the latest collection from June 2020.
At the end of each month I pull together a collection of links to some of the most relevant, interesting or thought-provoking web content I’ve come across during the previous month. Here’s the latest collection from May 2020.
September is a good time for reflection and attempts at renewal. I’ve just returned from a two-week break, with partially recharged batteries, and after a prolonged period of non-blogging it feels a suitable time to consider where things are and look at where they are going.
At the end of each month I pull together a collection of links to some of the most relevant, interesting or thought-provoking web content I’ve come across during the previous month. Here’s the latest collection from April 2020.
Last week marked the publishing of the final episode of the first first season of Explore Explain, the new video and podcast series I’ve launched this year.

A couple of years ago I embarked on a passion project to visualise Seinfeld, with the ambition of creating a large, detailed printed product to explore the rhythm and architecture of how this show was composed.

I’m delighted to launch the first season of Explore Explain, a video and podcast series about data visualisation design. For episode nine it was a pleasure to welcome Rachael Dottle.
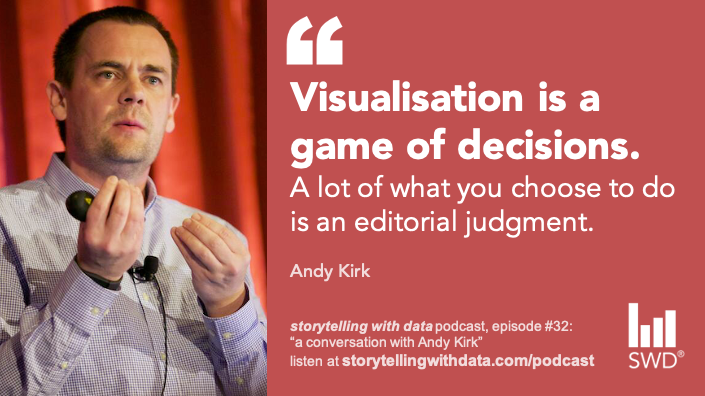
A couple of weeks ago I had the pleasure of being invited to record an episode of the ‘Storytelling With Data’ podcast with Cole Nussbaumer Knaflic
I’m delighted to launch the first season of Explore Explain, a video and podcast series about data visualisation design. For episode eight it was a pleasure to welcome Rachael Dottle.
I’m delighted to launch the first season of Explore Explain, a video and podcast series about data visualisation design. For episode seven it was a pleasure to welcome Jan Willem Tulp.
At the end of each month I pull together a collection of links to some of the most relevant, interesting or thought-provoking web content I’ve come across during the previous month. Here’s the latest collection from March 2020.
I’m delighted to launch the first season of Explore Explain, a video and podcast series about data visualisation design. For episode six it was a pleasure to welcome Sonja Kuijpers.
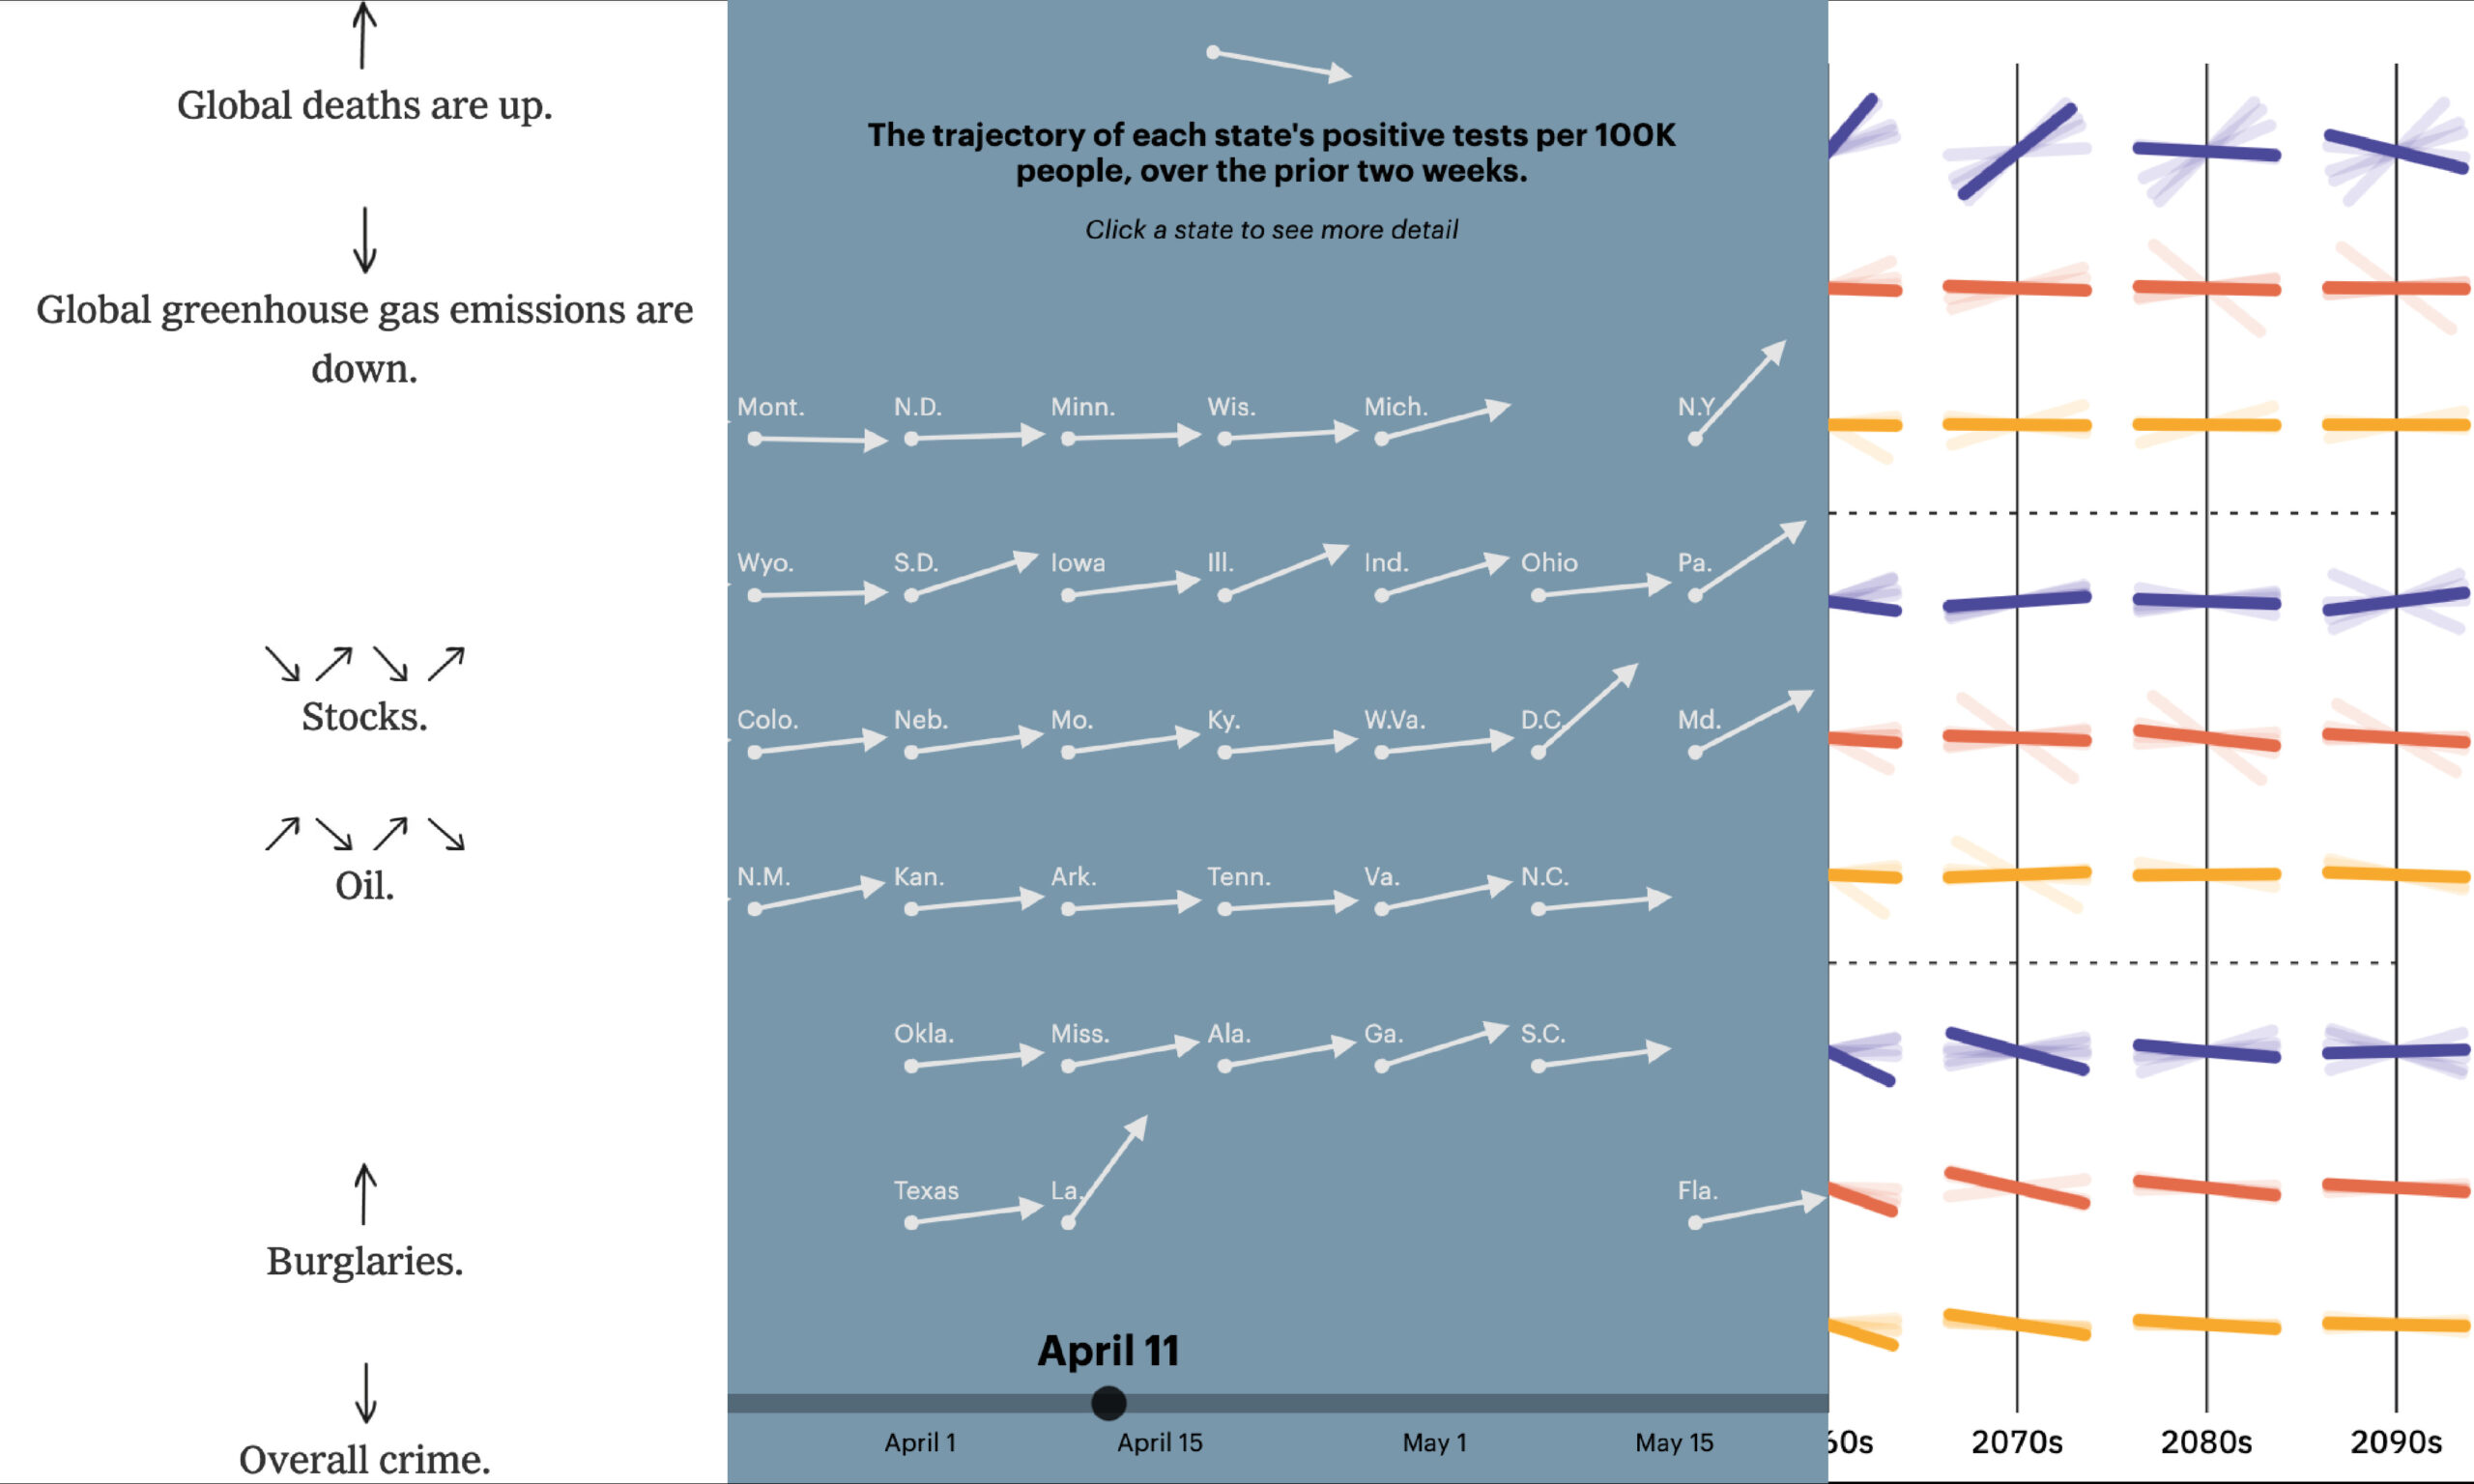
As somebody who tries to consume as much visualisation work as possible, I always get a little extra joy from seeing clusters of the same techniques emerging. One such recent trend has been the use of simplified slope graphs.

I’m delighted to launch the first season of Explore Explain, a video and podcast series about data visualisation design. For episode five it was a pleasure to welcome Simon Scarr.

I’m delighted to launch the first season of Explore Explain, a video and podcast series about data visualisation design. For episode four it was a pleasure to welcome Nadieh Bremer.
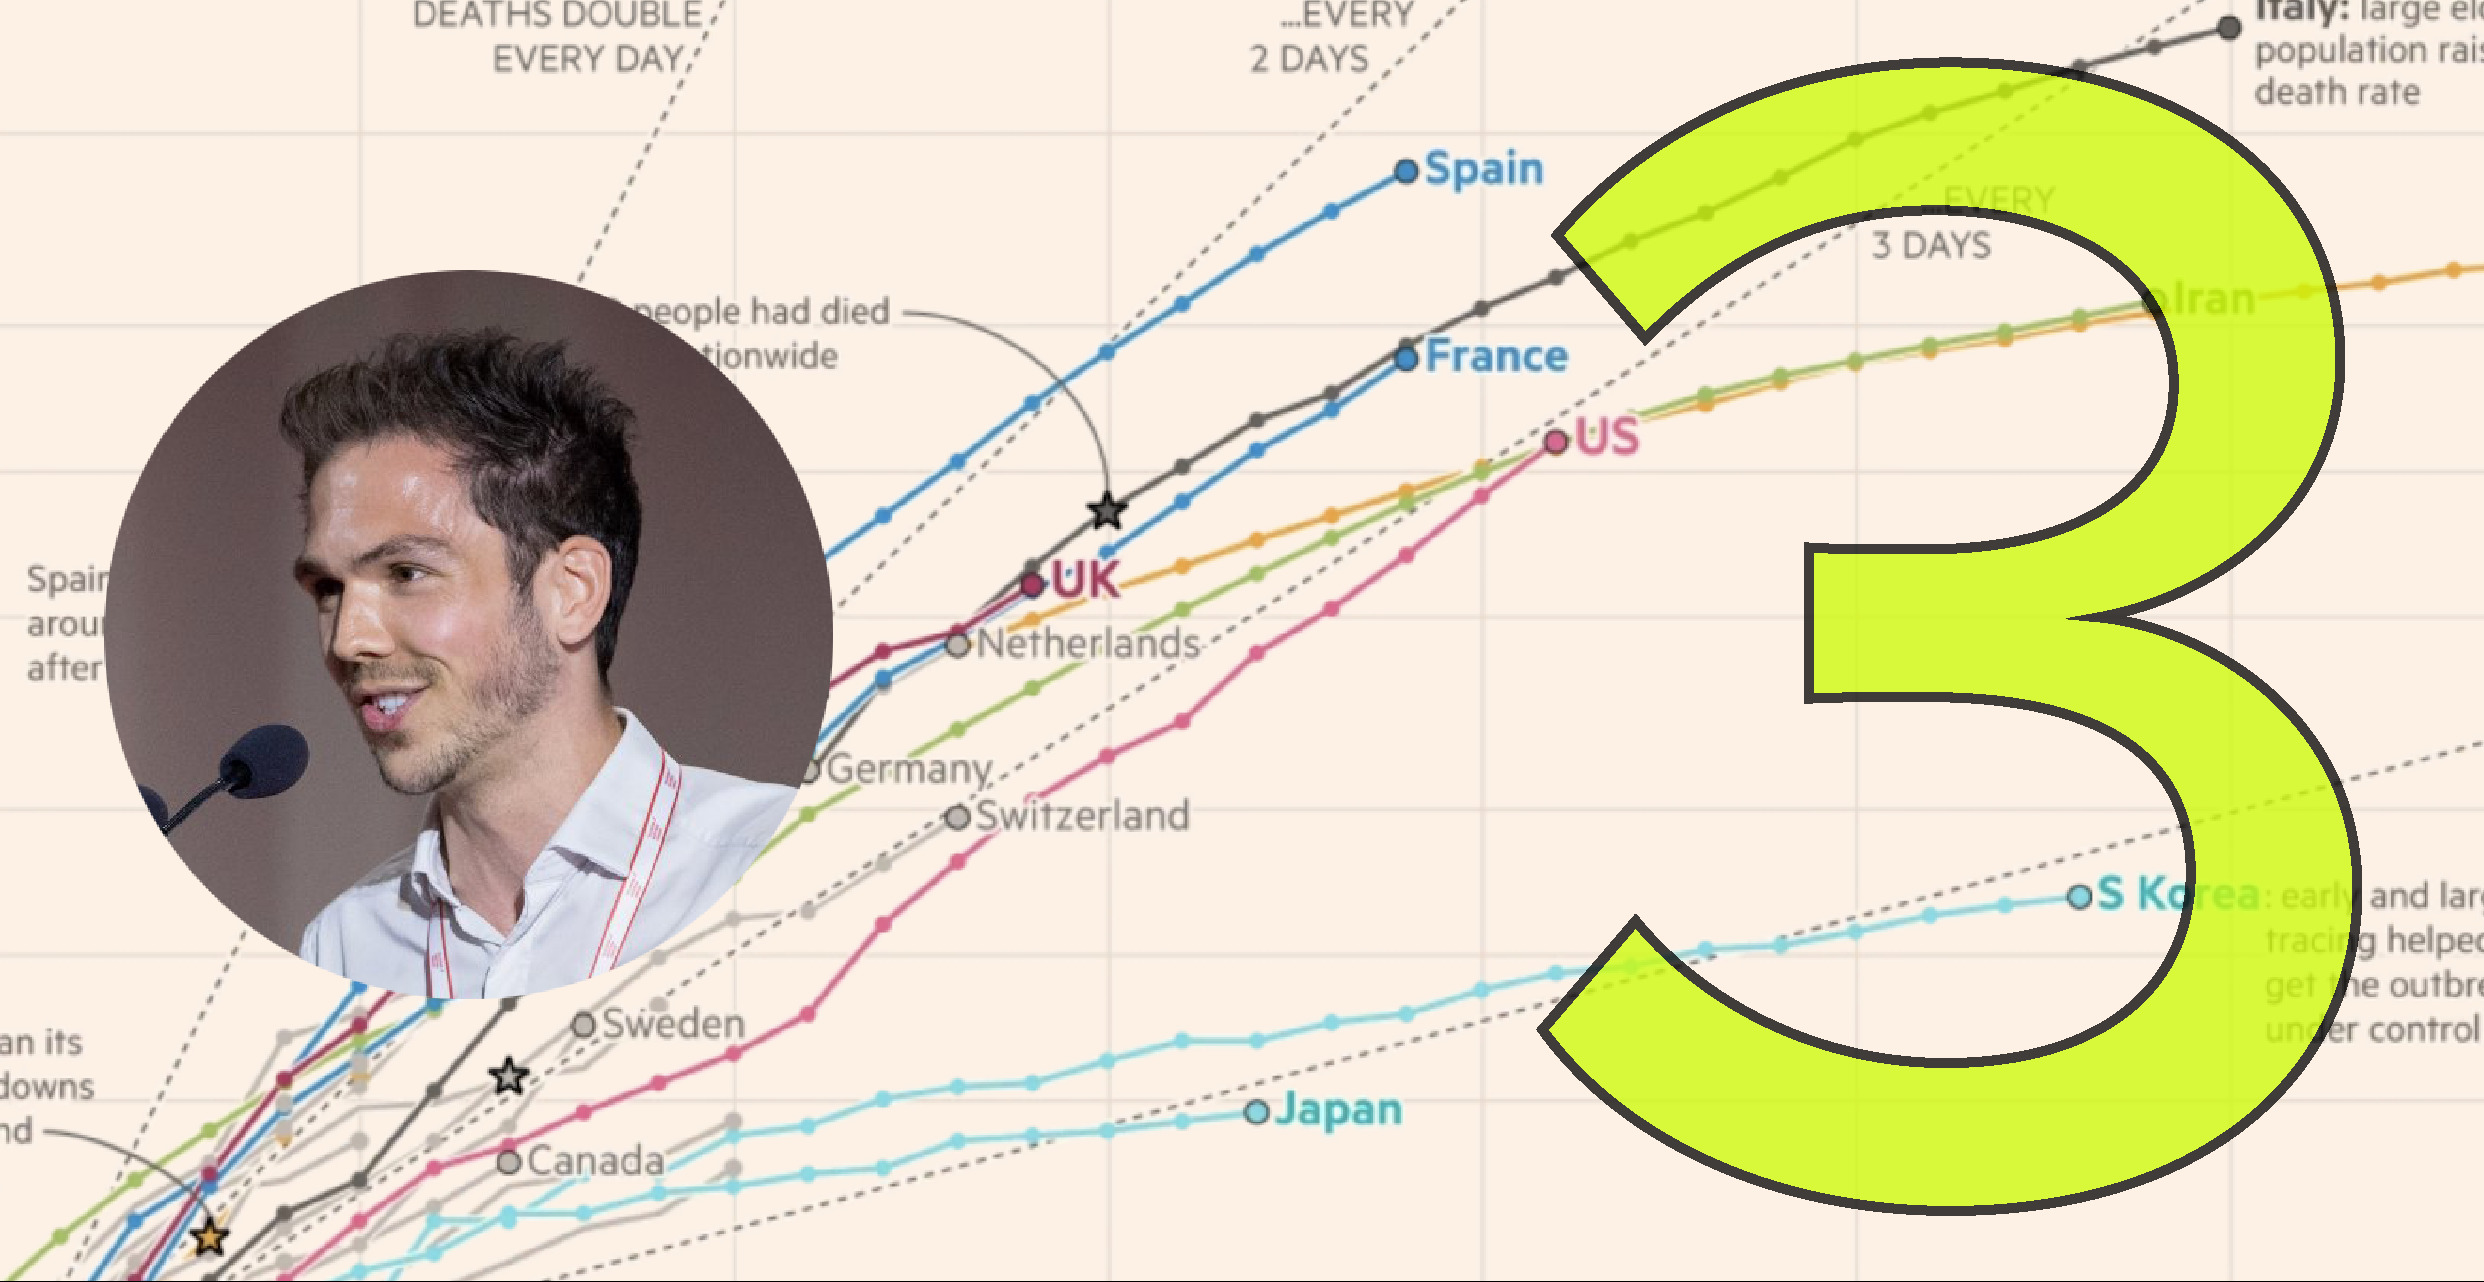
I’m delighted to launch the first season of Explore Explain, a video and podcast series about data visualisation design. For episode three it was a pleasure to welcome John Burn-Murdoch.
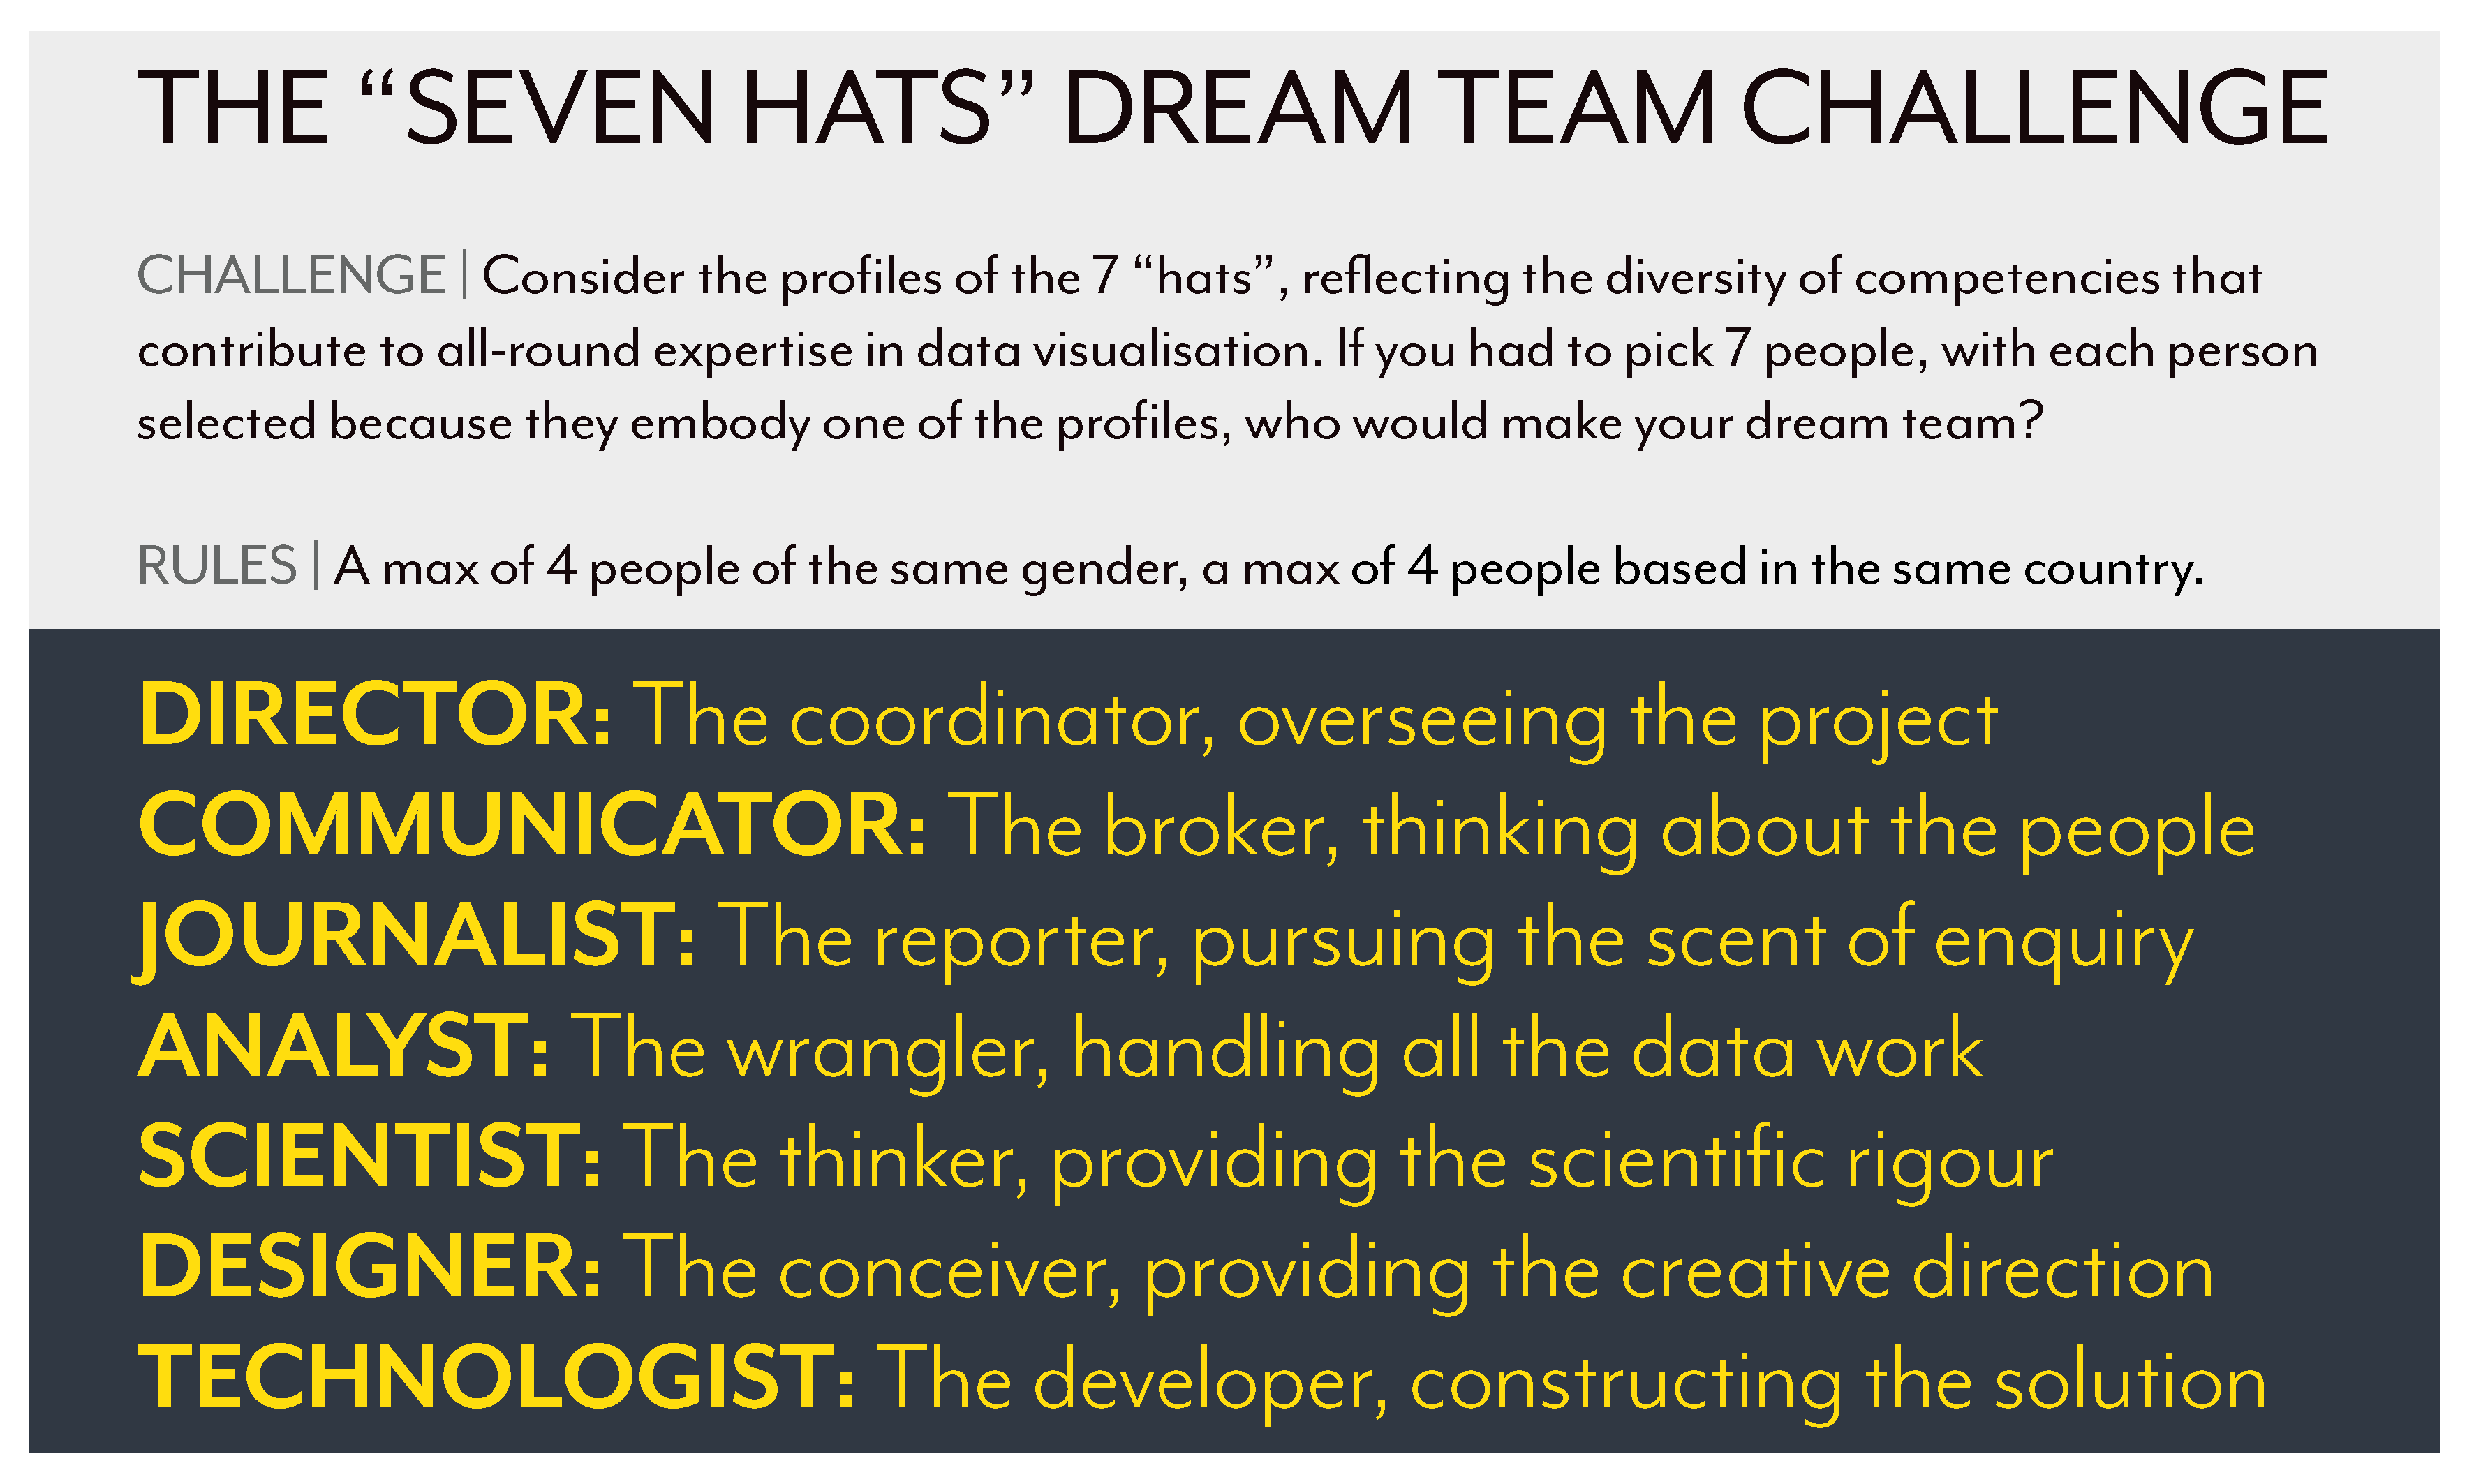
This made me wonder about a similar discussion in the context of data visualisation, and specifically the notion of a dream team. If you could form a team of skilled practitioners, each bringing a different core strength to the table, who would make the team?
At the end of each month I pull together a collection of links to some of the most relevant, interesting or thought-provoking web content I’ve come across during the previous month. Here’s the latest collection from February 2020.
I’m delighted to launch the first season of Explore Explain, a video and podcast series about data visualisation design. For episode two it was a pleasure to welcome Dr Cath Sleeman.