BLOG POSTS

Visualisingdata.com was originally launched in 2010 originally to serve as a blog to help continue the momentum of my learning from studying the subject via a Masters degree. I continue to publish articles and share announcements that track developments in my professional experiences as well as developments in the data visualisation field at large.

This is a collection of all my published posts, starting with the newest and dating back to 2010, tracking. These posts include articles, design commentaries, podcast updates, professional updates, and general news from across the data visualisation field.

Announcements

New site sponsorship opportunities

This is an announcement for anyone interested in sponsoring this website. I have decided to open up three new banner spaces on the Home page for interested parties to advertise their product, services or general offerings.

Read More →
Articles

Poll results: Let’s have a think about blue-pink

During the week I posted an article about some of the issues and options around using colour to represent gender (that is, the binary of Male or Female). I included a one-question poll to gather some insights about the attitudes out there towards the use of colour with gender.

Read More →
Articles

Dendrochronology and visualisation literacy

A quick post to share something that I’ve been really in to this past week or so: dendrochronology. Also known as tree-ring dating, it is the “scientific method of dating based on the analysis of patterns of tree rings”.

Read More →
Articles

Let’s have a think about blue-pink

You work you’re way through the data, come up with an idea for the most interesting angle of analysis, chart your data, and delight yourself with the compelling emerging display: look how clearly it shows the difference between men vs. women!

Read More →
Articles

Is it the visualisation or the data we like?

I’m musing about this visualisation work that has received a lot of love and attention on blogs and social media over the past few days. Created by the excellent people in the Wall Street Journal graphics team, it portrays data about the impact of vaccines in battling infectious diseases in the 20th Century.

Read More →
Articles

References for visualising uncertainty

One of the frequent questions I get asked, particularly by people from a scientific or financial domain, is how to effectively visualise uncertainty of data and of statistics. My response is usually to make suggestions around annotated markings and/or colour gradients to indicate increasing or declining certainties.

Read More →
Announcements

5 years of visualising data

Today I am celebrating the 5th birthday of visualisingdata.com and I wanted to thank every single one of the half a million visitors who have been to my site. Whether you have been along just the once or have been back time and time again, you have all helped to make this such an incredibly rewarding activity.

Read More →
Best Ofs

Best of the visualisation web… December 2014

At the end of each month I pull together a collection of links to some of the most relevant, interesting or thought-provoking web content I’ve come across during the previous month. Here’s the latest collection from December 2014.

Read More →
Design

New visual package for Chicago planning agency

There’s a smart new project from the team at Clever Franke who have created a digital package of visual content around the topics of ‘Mobility, Economy and Livability’ for CMAP, the regional planning agency for metropolitan Chicago.

Read More →
External

Data Stories podcast: Episode 46, a review and preview

It goes without saying how much of a privilege it is to be invited to contribute to a Data Stories podcast and last week I joined hosts Enrico and Moritz alongside Robert Kosara to review the major trends and developments during 2014 and preview the main hopes and expectations for 2015.

Read More →
Articles

Make grey your best friend

Anybody facing up to colour choices in any creative activity knows how critical such decisions can be between the success and failure of a design. This is amplified in data visualisation. In contrast to graphic design work, for example, there is greater need to eliminate or at least reduce arbitrary choices.

Read More →
Articles

Turn off the sea if you’re not using it

In an attempt to increase my blog post frequency, this year I’m going to publish more smaller posts that try to impart morsels of advice or thought-provocations about certain visualisation design matters. I’m going to start off 2015 focusing on a long-held gripe I have with map-based visualisations that colour the sea.

Read More →
Best Ofs

Best of the visualisation web… November 2014

At the end of each month I pull together a collection of links to some of the most relevant, interesting or thought-provoking web content I’ve come across during the previous month. Here’s the latest collection from November 2014.

Read More →
Articles

In defence of spreadsheets and our craft

Last week there was an article on Wired profiling an upcoming tool from Tableau called Elastic, which drew my ire. The tool looks fine, haven’t seen a great deal about it but I’m sure it will find a user base.

Read More →
Best Ofs

Best of the visualisation web… October 2014

At the end of each month I pull together a collection of links to some of the most relevant, interesting or thought-provoking web content I’ve come across during the previous month. Here’s the latest collection from October 2014.

Read More →
Announcements

Visualized.io talk preview: The design of time

Back in September I profiled the Visualized.io conference taking place in London this year. Time has raced by and the event is coming up this Saturday. I have the great fortune of being one of the invited speakers.

Read More →
Best Ofs

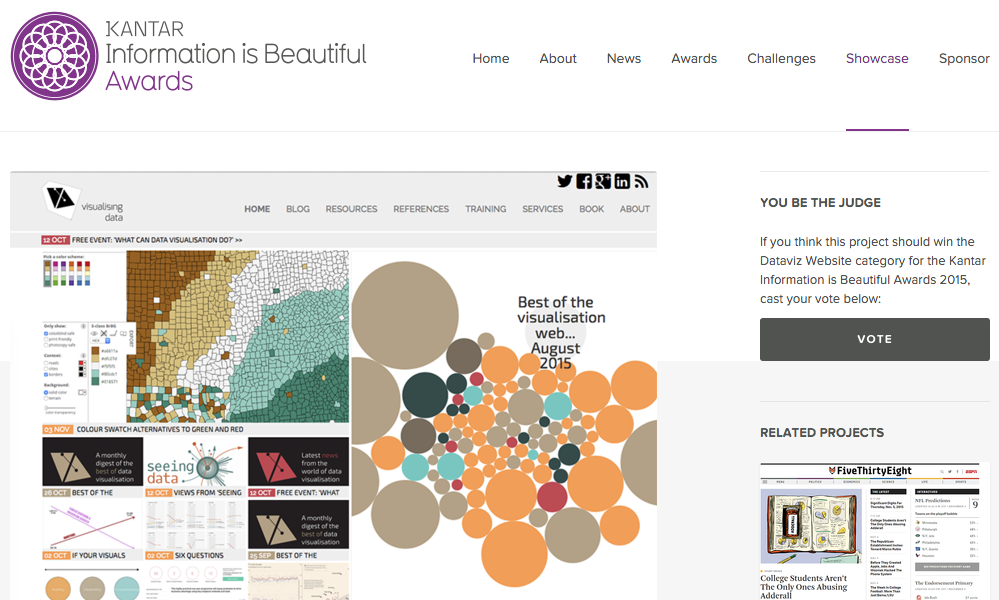
Best of the visualisation web… September 2014

At the end of each month I pull together a collection of links to some of the most relevant, interesting or thought-provoking web content I’ve come across during the previous month. Here’s the latest collection from September 2014.

Read More →
Articles

Preserving and archiving digital visualisation

I’ve had this issue on my mind for a while now but haven’t really found a way of expressing a cohesive post about it. I still haven’t, as you’ll find by the time you reach the bottom. Let me state from the outset: today, I am the problem guy, not the solution guy.

Read More →
Field News

Import.io Magic: Turn a webpage into data

Since first publishing my resources collection a couple of years ago I’ve been fortunate to have had lots of startups and vendors contact me to share news about their latest features and tools.

Read More →
Articles

When mapping spatial data really makes sense

As the final members of the graphics teams (1, 2, 3, 4 etc.) across the news media finally shut down their machines after a long night of mid-term election coverage, I am reminded of a great article by Matt Ericson from 2010 titled ‘When maps shouldn’t be maps’

Read More →
Design

Columbia University Library’s collection visualised

I have been exploring the absorbing ‘The Library Project’, a collaboration between the Spatial Information Design Lab at Columbia University, led by Laura Kurgan, and visualisation design/developers Annelie Berner, Jen Lowe and Derek Watkins.

Read More →
Design

Visualisation shoots from all angles

Earlier this week I published my slides from a talk I gave last week in San Francisco. One of the key things I discussed was the importance of carefully considering your editorial focus and I equated some of the ideas to the world of photojournalism.

Read More →
Announcements

Updated: 99 data visualisation and related books

Over on my ‘References’ page, I have updated the collection of data visualisation and related books. The list is now up to 99 titles, which makes for a nice soundbitey title but it will continue to grow and in a more timely manner than before now.

Read More →