
Collections
Part 2: The essential collection of visualisation resources
The contents of this post are now published on the interactive Resources page

The contents of this post are now published on the interactive Resources page

At the end of each month I pull together a collection of links to some of the most relevant, interesting and useful articles I’ve come across during the previous month. Here’s the latest collection from February 2011
The contents of this post are now published on the interactive Resources page
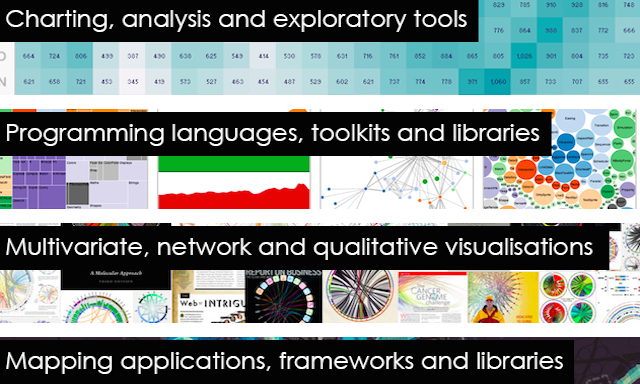
Tomorrow will see the launch of a new series entitled “the essential collection of visualisation resources”. This will be a multi-post series designed to share with readers an inspiring collection of the most important, effective, useful, practical and affordable data visualisation resources.
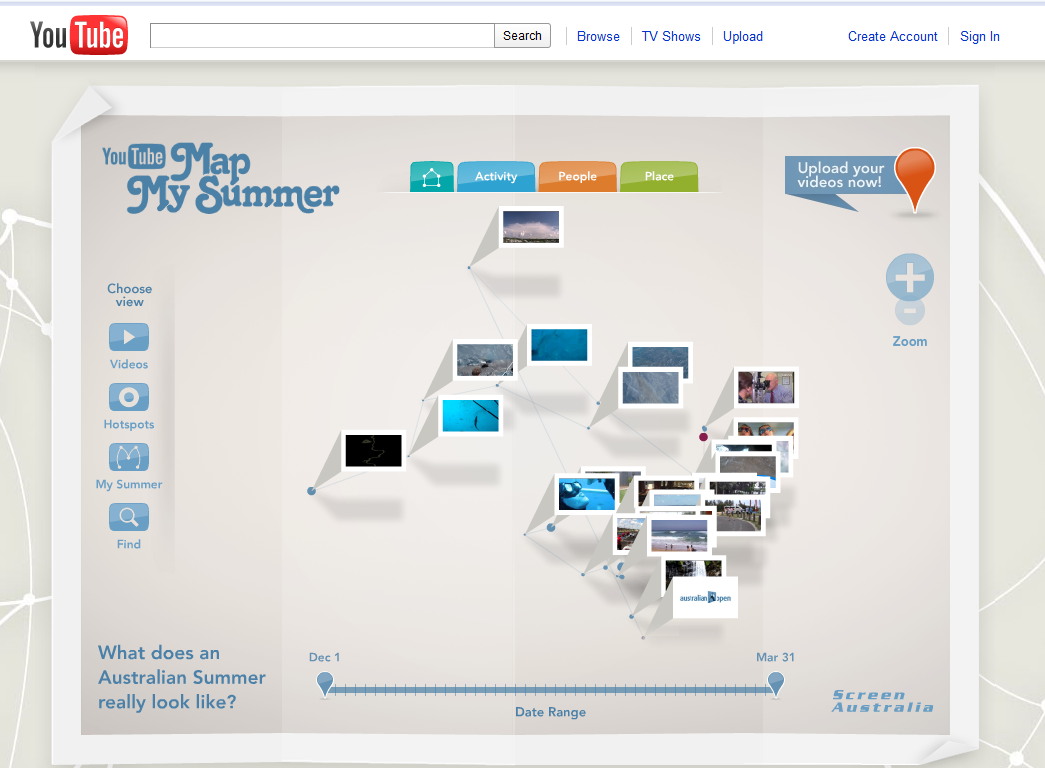
Kristian Saliba, a digital art director for Three Drunk Monkeys creative agency (Sydney, Australia), has sent me details of an interesting project that has just been launched for YouTube titled ‘Map My Summer’.
At the end of each month I pull together a collection of links to some of the most relevant, interesting and useful articles I’ve come across during the previous month. Here’s the latest collection from January 2011

Back in May 2010 the World Bank announced that it was launching a portal to open up access to its vast datasets and creating a platform for developers to make this data more accessible and facilitate greater insights.
At the end of each month I pull together a collection of links to some of the most relevant, interesting and useful articles I’ve come across during the previous month. Here’s the latest collection from December 2010:
At the end of each month I pull together a collection of links to some of the most relevant, interesting and useful articles I’ve come across during the previous month. Here’s the latest collection from November 2010
A couple of weeks ago I launched a contest for one lucky reader to win a full conference pass to the O’Reilly Strata ‘Making Data Work’ conference taking place in Santa Clara, CA in February 2011.
At the end of each month I pull together a collection of links to some of the most relevant, interesting and useful articles I’ve come across during the previous month. Here’s the latest collection from October 2010
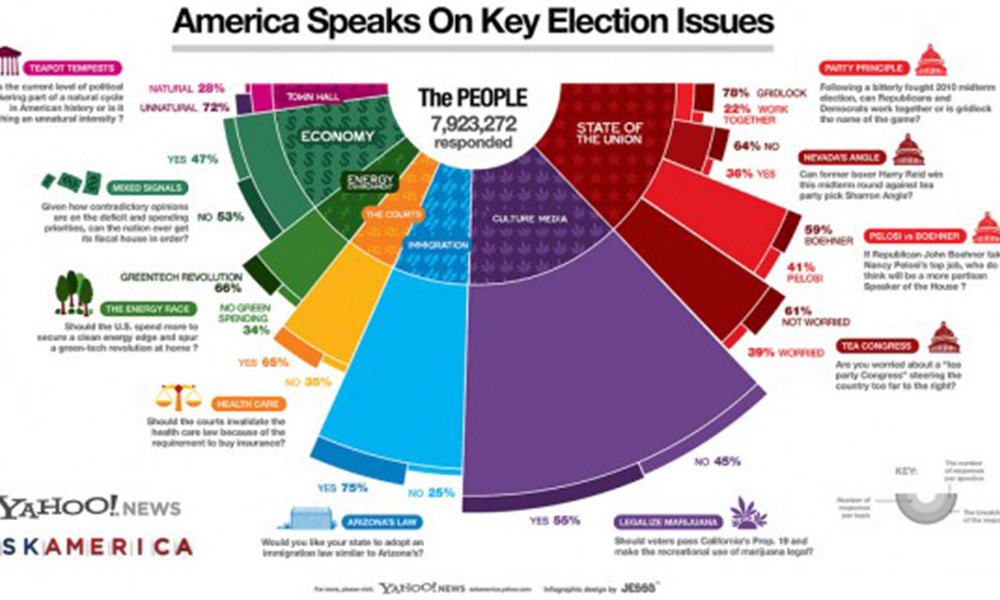
I’ve come across this infographic produced in a collaboration between visualisation studio JESS3 and Yahoo! News Ask America and find it difficult to interpret. This
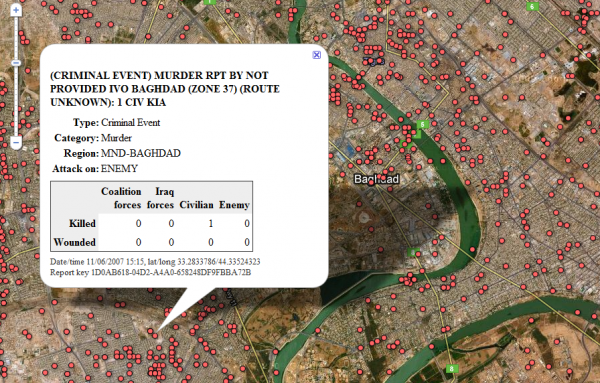
In the past hour, WikiLeaks (Twitter feed) has released the largest classified military leak in history. The release contains 391,832 reports documenting the Iraq conflict from 1st January 2004 to 31st December 2009 (except for May 2004 and March 2009).

In advance of tomorrow’s announcement from the Government about the outcome of the Comprehensive Spending Review, today’s online edition of the Guardian has a great

Reader Mark Lukas has been in touch to share details of an interesting Augmented Reality (AR) project he has been working on. For those of
At the end of each month I pull together a collection of links to some of the most relevant, interesting and useful articles I’ve come across during the previous month. Here’s the latest collection from September 2010.
This is a follow-up post to my third article in the Visualisation Insights series which I published earlier this week. The purpose of this companion
This is the third part in my Visualisation Insights series. The purpose of these posts is to provide readers with unique insights into the field

“You must come round and look at my holiday photos” is a phrase that sends shivers down most spines, mine included. Nevertheless, I wanted to
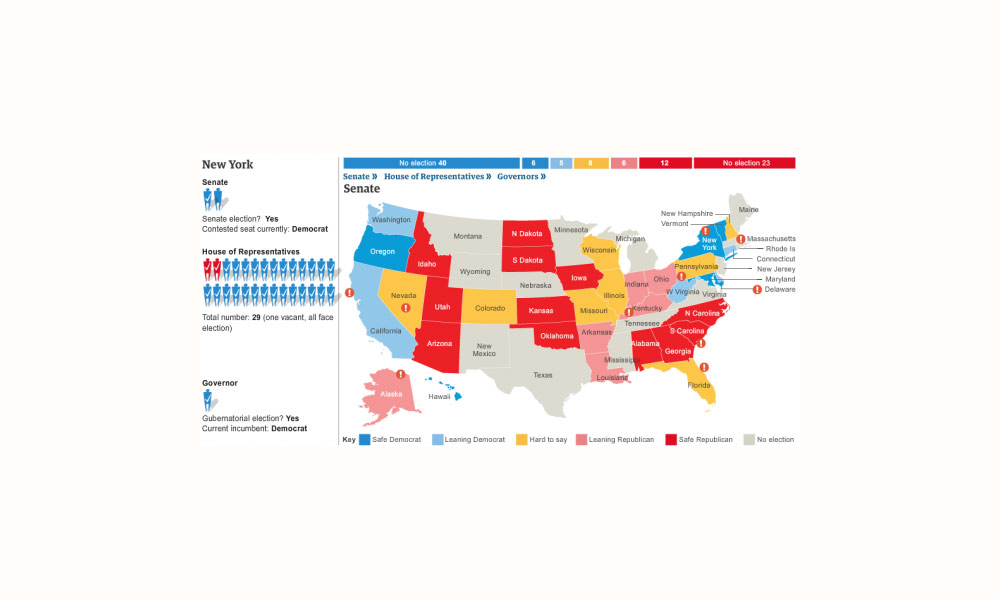
On 2 November, the US holds midterm elections to Congress. To allow UK readers (in particular) to learn more about what these midterms involve and

I’m very excited to be making my first ever visit to New York in a few days time. Besides trying to fit in 2 weeks

One of the many RSS subscriptions that keep my Google Reader working overtime is Jan Schultink’s Sticky Slides blog, which provides a lot of useful
Over the several years I have been immersed in data visualisation there have been many occasions when I’ve come across a graphic that is largely
Spotted on Wired, the developers responsible for Last.fm’s ‘VIP playground’ have announced the launch of a visualisation service that plots subscribers’ listening habits over a
At the end of each month I pull together a collection of links to some of the most relevant, interesting and useful articles I’ve come across during the previous month. Here’s the latest collection from August 2010
A new political blog/sub-domain of the New York Times website officially launched this week and you should keep your eyes on its progress – the

This is a follow-up post to my second article in the Visualisation Insights series which I published early this week. The purpose of this companion
This is the second part of my recently launched Visualisation Insights series. The purpose of this series is to provide readers with unique insights into

The OFCOM Communications Market Report 2010 has been published today. For those who don’t know about OFCOM it is the independent regulator and competition authority for
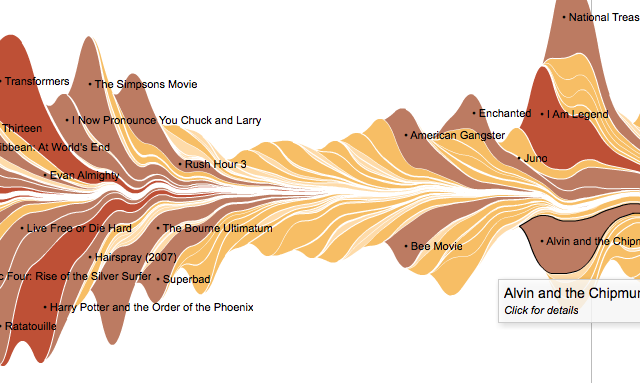
Over the past couple of months I’ve noticed a number of new examples of streamgraphs working their way around the web. It has prompted me to finally get around to visiting this subject because these graphs always seem to stir great debate, one which seems to perfectly encapsulate the ongoing challenges faced within the visualisation field