Design
Tyne: Visualisation of data from Newcastle’s River Tyne
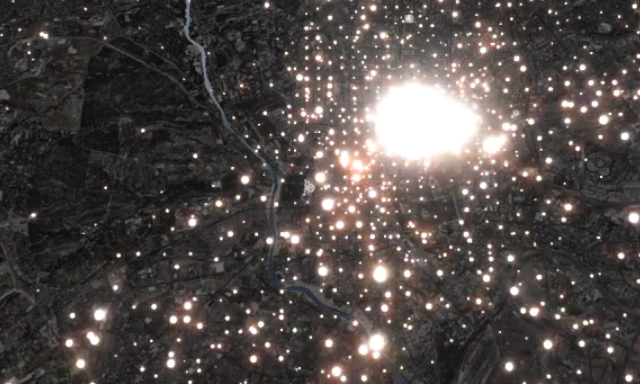
We’ve seen a number of recent developments where particle flow has been visualised in fascinating ways to depict natural phenomena such as wind, the Oceans and water.

We’ve seen a number of recent developments where particle flow has been visualised in fascinating ways to depict natural phenomena such as wind, the Oceans and water.

Santiago Ortiz, genuinely one of the most creative and interesting freelance designers practicing in the field right now, has published a new interactive project: the ‘Data visualization references network’.

The issue of plagiarism vs. inspiration is not a new topic, it has been with us for years and is the fundamental basis of copyright and IP, but it is an increasingly important consideration for us in the visualisation field.
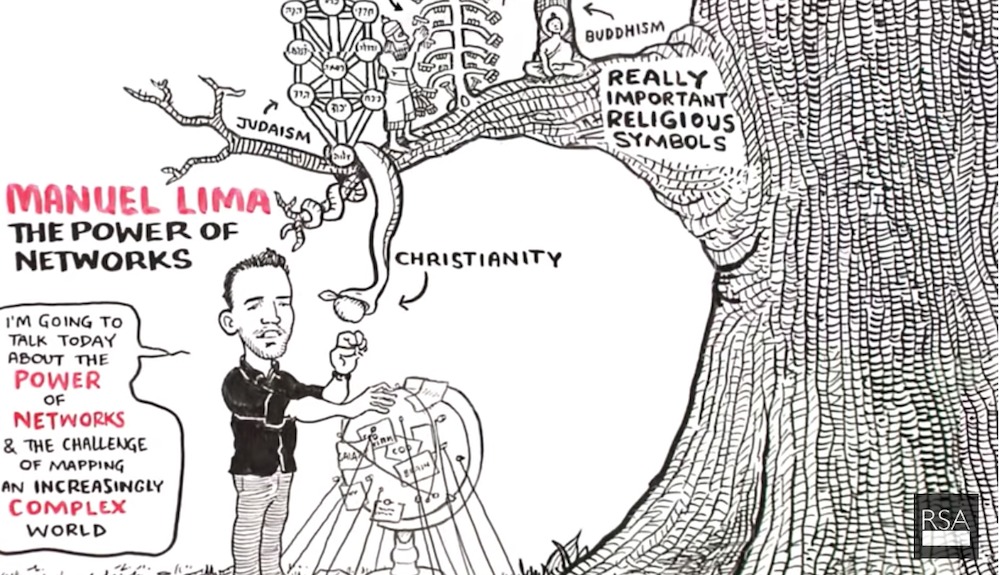
Those of you who have watched the video footage from the recent SEE conference may have seen Manuel Lima’s talk on the ‘The Power of Networks: Knowledge in an age of infinite interconnectedness’.

At the end of each month I pull together a collection of links to some of the most relevant, interesting or thought-provoking web content I’ve come across during the previous month. Here’s part one of the latest collection from April 2012.
At the end of each month I pull together a collection of links to some of the most relevant, interesting or thought-provoking web content I’ve come across during the previous month. Here’s part one of the latest collection from April 2012
Hello everyone. I felt compelled to break the silence with a brief update on matters. I’ve had quite a lot of traffic round these parts of late, thanks to sharing of my data journalism handbook post and Nathan’s inclusion of my site on his collection of blog reads.
Hot from the Bremen sound studio is the brand new release of Episode 5 of the Data Stories podcast with Enrico, Moritz and me, as a returning invited guest. In this episode we cover the subject of data visualisation training, a subject clearly close to my heart.
I typically save updates like this for Twitter, but I am aware that not everybody is on Twitter (just yet, anyway) and there’s only so much you can pack in to 140 characters. So here is a brief update on a few things relating to my ‘Introduction to Data Visualisation’ training courses.
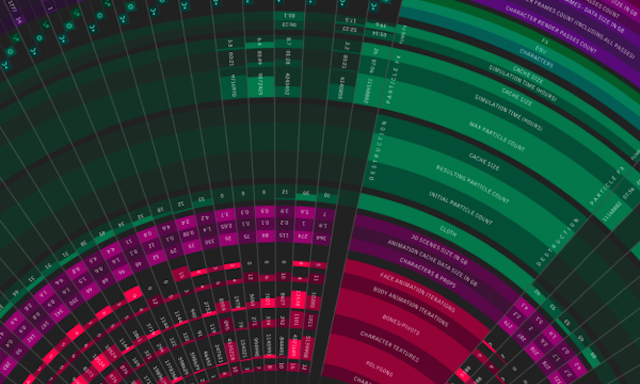
Platage Image is a Poland-based high-quality animation studio. Today they have shared details of their recent work for a promotional/introductory video for the forthcoming Xbox 360 video game ‘The Witcher 2’.
At the end of each month I pull together a collection of links to some of the most relevant, interesting or thought-provoking web content I’ve come across during the previous month. Here’s part one of the latest collection from March 2012
At the end of each month I pull together a collection of links to some of the most relevant, interesting or thought-provoking web content I’ve come across during the previous month. Here’s part one of the latest collection from March 2012
As we approach the summer (though seemingly not in the North of England just yet… brrrrr) and the Euro 2012 football championships, it is sobering to think how fast the previous four years have gone by since Spain won the 2008 event.
At the end of each month I pull together a collection of links to some of the most relevant, interesting or thought-provoking web content I’ve come across during the previous month. Here’s part one of the latest collection from February 2012
At the end of each month I pull together a collection of links to some of the most relevant, interesting or thought-provoking web content I’ve come across during the previous month. Here’s part one of the latest collection from February 2012.
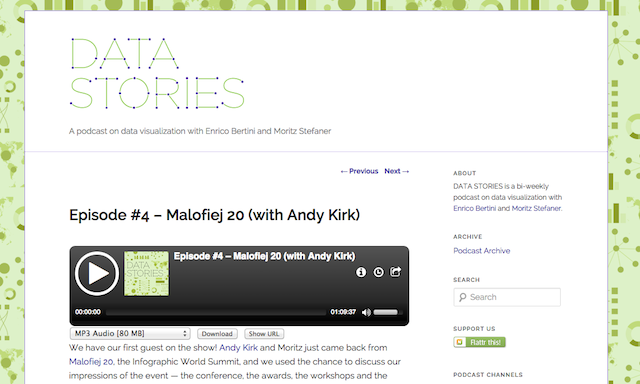
This is not a post so much as a pointer to the just-released-this-minute Episode 4 of the Data Stories podcast with Enrico, Moritz and me as an invited guest. In this episode we do a reflection on Malofiej20
Below you will find an embedded slideshare version of the slides used in my Malofiej talk. I’m often reluctant to share slides from presentations because
As the occasionally elusive Pamplonan sun sets on Malofiej 20, I wanted to share my experiences of these past seven days which have formed the
Back in December I expressed my great delight at having been invited to judge, speak and attend the 20th Malofiej Infographics World Summit. Well, time has sped by and on Saturday I will be flying over to Pamplona to kick off this prestigious week long event – as Robert Kosara put it, the Pulitzer Prize of Information Graphics.

In the latest Datastories podcast, from the “Exotic European Voiced” due of Bertini and Stefaner, there was some interesting discussion about the rights and wrongs of visualisation contests and the debate touched on the concept of awards.
Datawrapper is a brand new tool unveiled by ABZV, a German training institution for newspaper journalists, but primarily the result of the vision, talent and commitment of Mirko Lorenz and Nicolas Kayser-Bril.
At the end of each month I pull together a collection of links to some of the most relevant, interesting or thought-provoking web content I’ve come across during the previous month. Here’s part two of the latest collection from January 2012.
At the end of each month I pull together a collection of links to some of the most relevant, interesting or thought-provoking web content I’ve come across during the previous month. If you follow me on Twitter and Google+ you will see many of these items shared as soon as I find them.
Last week I celebrated this website’s second birthday and posted details of an amazing, sensational, once-in-a-lifetime opportunity for a lucky reader to win a prize to attend one of my ‘Introduction to Data Visualisation’ training course free of charge.
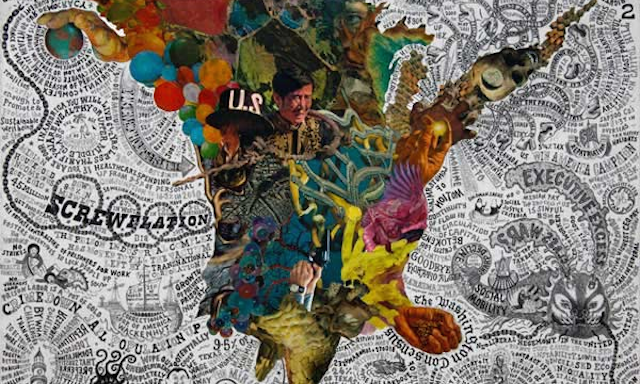
Esquire magazine (or more accurately the web version) has published the results of an interesting project titled ‘The United States of 2012’ where they commissioned five different mapping concepts from a range of artists and designers to “reflect the state of things this year”.
I’ve been contacted by Liliana Bounegru, a Project Manager from the European Journalism Centre, to help try and attract a potential contributor or contributors to the task of writing the first collaborative Data Journalism Handbook.
A couple of weeks ago Tableau announced the launch of version 7.0 of their popular Business Intelligence and Visual Analytics software. To find out more about this development I invited Craig Bloodworth, a Tableau evangelist and consultant for The Information Lab to highlight some of the new data visualisation features and enhancements.
Last month I shared details of the locations where I was planning to deliver my “Introduction to Data Visualisation” training courses during the first half of 2012. I’m delighted to announce more details about the schedule, specifically the dates of the events.
At the end of each month I pull together a collection of links to some of the most relevant, interesting or thought-provoking web content I’ve come across during the previous month. Here’s part two of the latest collection from December 2011.
At the end of each month I pull together a collection of links to some of the most relevant, interesting or thought-provoking web content I’ve come across during the previous month. Here’s part one of the latest collection from December 2011.
