5 (+1) book recommendations for World Book Day
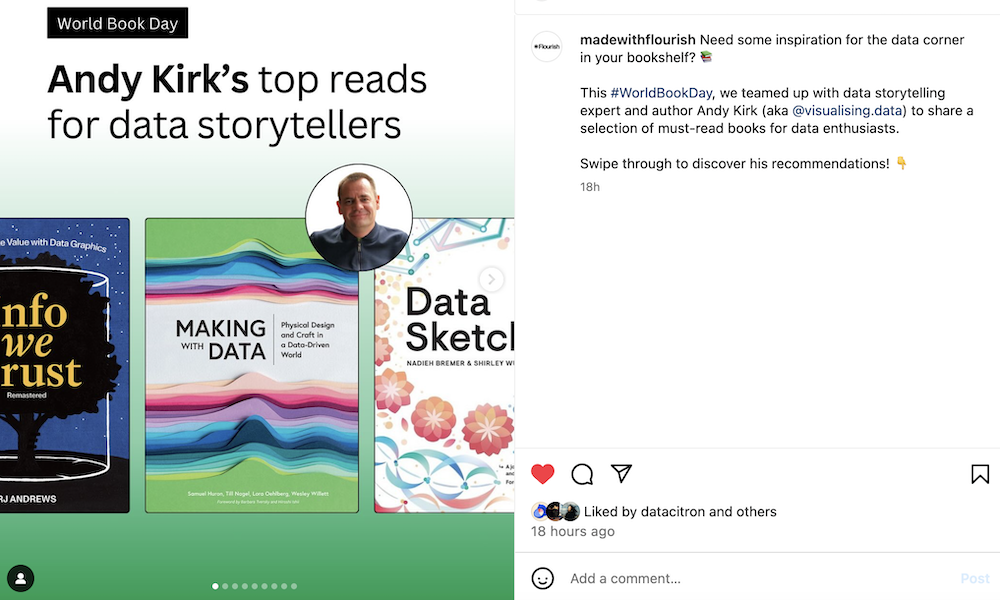
To mark World Book Day the lovely people at Flourish invited me to propose five data viz titles that I think should belong on peoples’ book shelves.
5 (+1) book recommendations for World Book Day Read More »