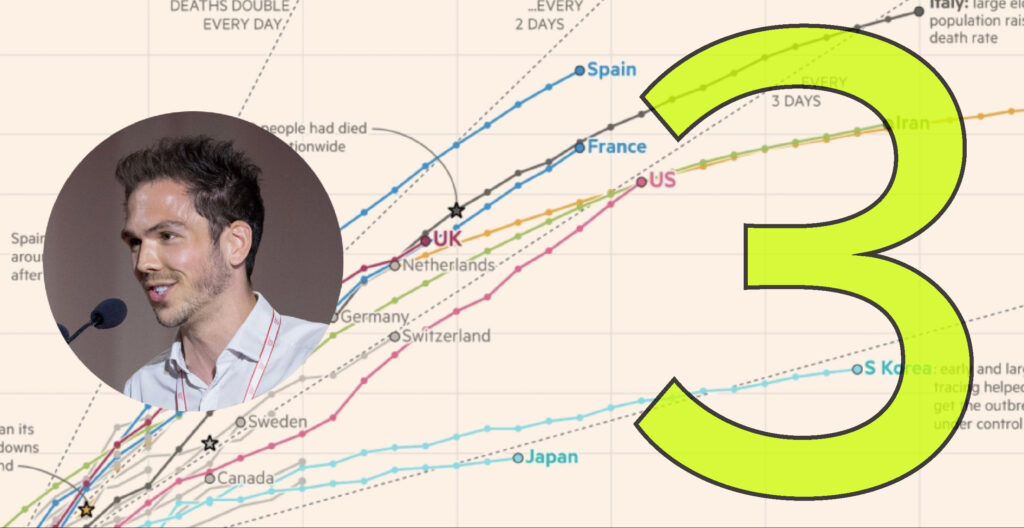
New online data visualisation training courses
I’m therefore happy to announce details of new plans to pivot my data visualisation training offerings online.
New online data visualisation training courses Read More »
I’m therefore happy to announce details of new plans to pivot my data visualisation training offerings online.
New online data visualisation training courses Read More »
To mark each mid-year and end of year milestone I try to take a reflective glance over the previous 6 months period in the data visualisation field and compile a collection of some of the most significant developments. These are the main projects, events, new sites, trends, personalities and general observations that have struck me as being important to help further the development of this field.
10 significant visualisation developments: July to December 2019 Read More »
Coverage of the Coronavirus outbreak is everywhere as news media, governments and health organisations across the globe analyse its spread and impact.
Communication themes from Coronavirus outbreak Read More »
At the end of each month I pull together a collection of links to some of the most relevant, interesting or thought-provoking web content I’ve come across during the previous month. Here’s the latest collection from December 2019.
Best of the visualisation web… December 2019 Read More »
Today marks the 10 year anniversary of Visualising Data being a thing. A thing that thankfully continues to exist as a website, as an identity, and as a commercial enterprise.
Visualising Data is Ten Years Old Read More »
This is part of a series of posts about the ‘little of visualisation design’, respecting the small decisions that make a big difference towards the good and bad of this discipline.
The little of visualisation design: Part 72 Read More »
At the end of each month I pull together a collection of links to some of the most relevant, interesting or thought-provoking web content I’ve come across during the previous month. Here’s the latest collection from November 2019.
Best of the visualisation web… November 2019 Read More »
This is part of a series of posts about the ‘little of visualisation design’, respecting the small decisions that make a big difference towards the good and bad of this discipline.
The little of visualisation design: Part 71 Read More »
Explore/Explain is a new series of conversations I am recording with data visualisers about their work. The recordings will be published in both video and audio podcast format. I will be the presenter/chief interrogator and I’m delighted to be supported by Matt Knott as producer.
‘Explore/Explain’, a New Video and Podcast Series Read More »
At the end of each month I pull together a collection of links to some of the most relevant, interesting or thought-provoking web content I’ve come across during the previous month. Here’s the latest collection from October 2019.
Best of the visualisation web… October 2019 Read More »