Andy Kirk

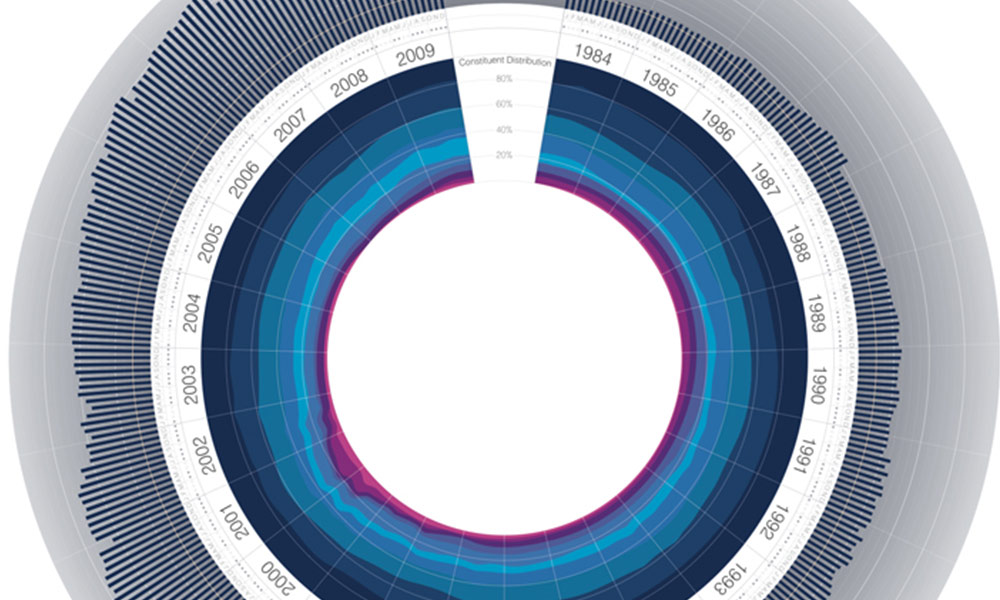
Radial plot of FTSE 100

A series of charts by Jeremy Christopher depicting the history, worth and composition of the FTSE 100 share index have been doing the rounds over the past 24 hours (first seen via DataVisualization.ch). The image below is probably the most discussed and shared of this short series of 3 charts. It visualises the FTSE’s index […]

Radial plot of FTSE 100 Read More »

Microsoft’s PivotViewer data visualisation tool

As reported by ResellerNews, Microsoft has today released PivotViewer – an interactive visualisation tool designed to help browse, organise and analyse massive image collections and data sets by displaying dynamic visual summaries through your browser. I’ve not had chance to play with it yet but from first impressions based on watching the official launch videos

Microsoft’s PivotViewer data visualisation tool Read More »