As many will testify, for years Twitter was the social media platform for following and participating in the data visualisation field. Despite its dark corners, the data viz bubble was lit up by the sharing of new works, new articles, interesting discussions, the discovering of new people, and sourcing new trends. It was also a place for people outside of the data visualisation field to find the people in the data visualisation field.
As I have posted elsewhere, the sinking of Twitter’s functional and moral appeal has disrupted and fragmented the community and killed it as the essential platform of activity. Twitter may continue but the damage has been done in terms of it being seen as the main reliable source of the community’s work.
In November 2022, soon after Twitter’s takeover, I shared a piece about my then-intentions for how and where I would look to continue posting across different platforms as well as find ways new ways to follow and interact with people in this field. Things have changed a lot, even in just that intervening year and a bit, and I think its worth reflecting on the broad purpose for being present and engaged on public platforms.
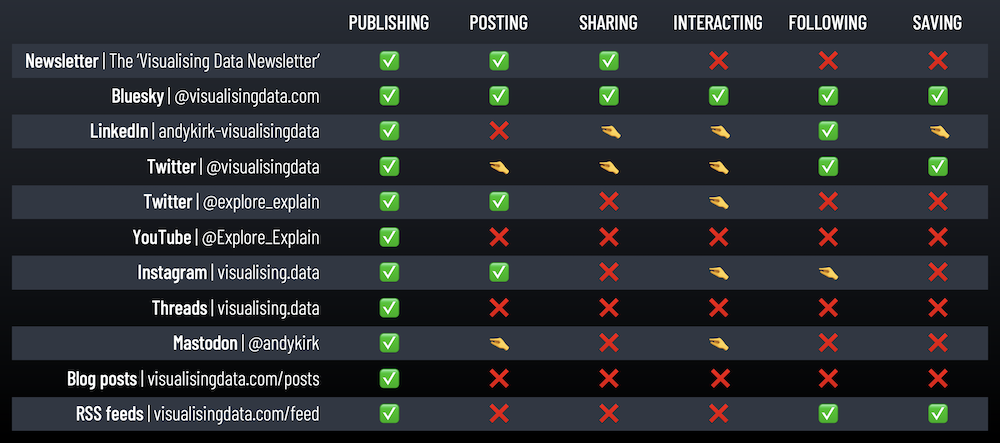
Therefore, as much for my benefit as for the clarity it gives others, I’ve decided to compile an updated profile of where you will find me across the web’s places and platforms and the nature and extent to which I will be active with each.
- Publishing – announcing new work or updates about my professional services and posting links to the related content on my website (including blog articles, training courses, podcasts)
- Posting – posting thoughts, questions, announcements, or occasionally off-topic musings
- Sharing – amplifying the published works or posts of others (eg. retweeting)
- Interacting – responding to people who write to me, writing to people who have not written to me
- Following – keeping an eye on latest published works, articles or postings, discovering new people through what others share
- Saving – bookmarking or liking (for the purpose of also bookmarking)
Key: ✅ Definitely, lots of this stuff | 🤏 Maybe, or just a bit of this stuff | ❌ Rarely, or none of this stuff
Newsletter | The ‘Visualising Data Newsletter’
I recently announced my new newsletter which will be launching in February 2024. For subscribers, this will offer a monthly round-up chronicling the latest notable work in this field straight to your inbox. It will also include updates about new content or announcements from me and about my work, such as new training courses, new podcast episodes, latest or upcoming appearances. Other than directly visiting my website, it will be the most convenient way to follow updates about my work going forward.
Publishing ✅
Posting ✅
Sharing ✅
Interacting ❌
Following ❌
Saving ❌
Bluesky | @visualisingdata.com
Bluesky really emerged during the second half of 2023 as perhaps the most promising new social media option post-twitter. With many of the same features (in place or to come) and with lots of prominent people from the data viz world popping up on there, it feels like a viable platform for recreating some of the old twitter magic. Despite persisting so far with an invite-code only path for new users to join, there are enough people in place on there with the means to share invitations for those not yet onboard.
Publishing ✅
Posting ✅
Sharing ✅
Interacting ✅
Following ✅
Saving ✅
LinkedIn | andykirk-visualisingdata
I was quite late to the LinkedIn party (smart casual, last orders 10pm) and a bit sceptical about the scope of LinkedIn as an additional social network worth pursuing. I’d previously felt it was just a marketplace for recruiting or being recruited and so, as a freelancer, neither state was relevant to me. However, since joining in 2020, I have found it to be a valuable platform and have enjoyed useful engagement on there. Like a workplace, its not a place for idle chatter, but I will be doing more to follow other people, share their work and interact, or at least more than I have been doing (which has been close to nothing).
Publishing ✅
Posting ❌
Sharing 🤏
Interacting 🤏
Following ✅
Saving 🤏
Twitter | @visualisingdata
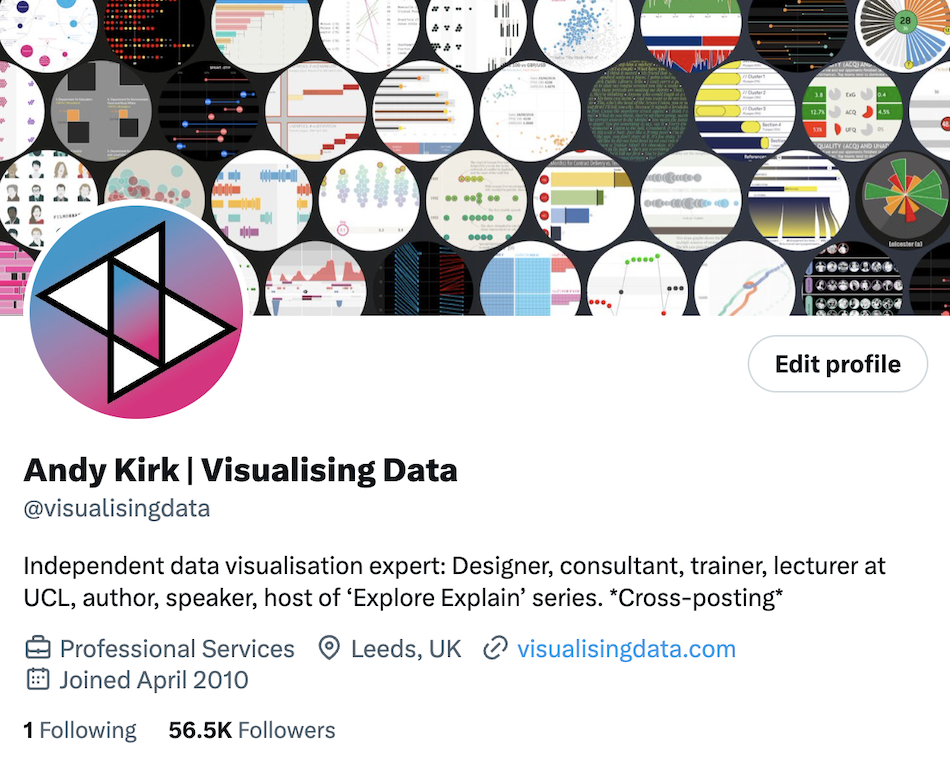
I joined Twitter in April 2010 and have since managed to build a decent profile, not least thanks to the timing of my joining and the subsequent growth of the field over the years that followed. I’ve said enough about how its no longer the place it once was. Though my following number still appears high, I recognise a large proportion of those accounts are no longer active or are just not real people. However, I will maintain my presence on Twitter because there are still people on there for whom this will continue to be their primary method for accessing updates. I’ve especially noticed people from regions outside of my English-speaking or Western-centric bubble remain active. I will continue to follow people (silently, using lists), but, beyond sharing my published post updates, I will be reducing a lot of my content-contributing and interaction activity to the extent there will no longer be anything posted exclusively on Twitter that can’t also be found on other platforms.
Publishing ✅
Posting 🤏
Sharing 🤏
Interacting 🤏
Following ✅
Saving ✅
Twitter | @Explore_Explain
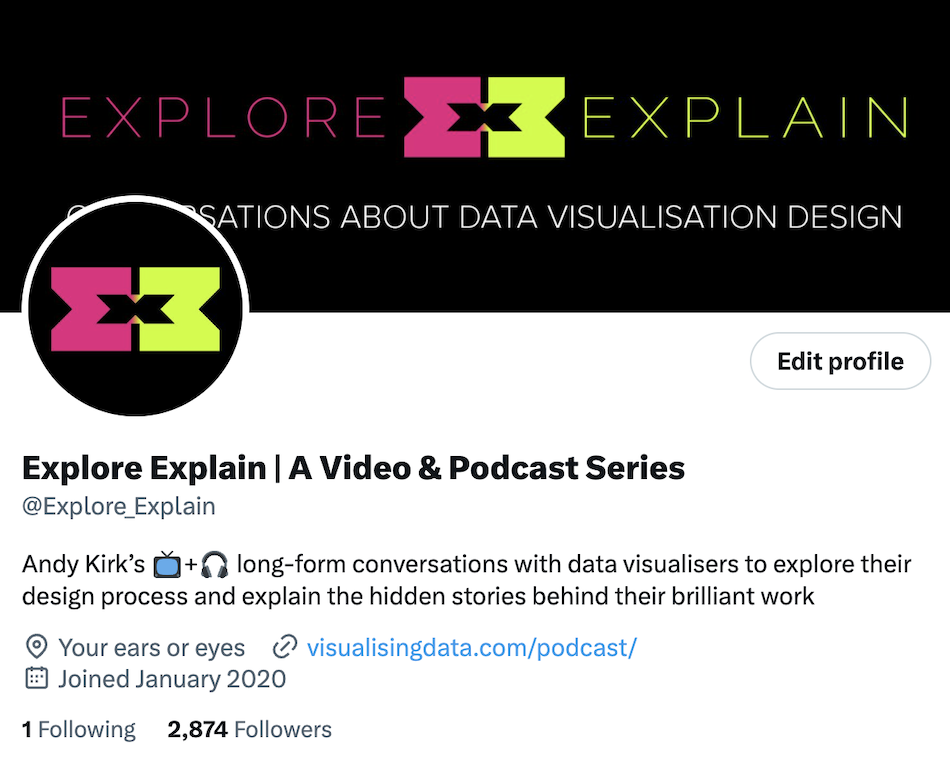
This is my second Twitter account dedicated to my podcast and video series, Explore Explain. Followers should expect to continue to see updates about new episodes, previews of upcoming guest interviews, and revisits to episodes from past seasons. Beyond this twitter feed, and the source posts on my website, you can also receive updates of new episodes through subscribing from any of the common podcast platforms (you can add a feed with the URL feed.pod.co/exploreexplain).
Publishing ✅
Posting ✅
Sharing ❌
Interacting 🤏
Following ❌
Saving ❌
YouTube | @Explore_Explain
Although all of my podcast episodes are released in audio format, most of the production work is directed towards to the video versions. On YouTube you will find the @explore_explain channel with playlists of all videos organised by season, by region (of guest), and by category of topics. There are the full episode versions as well as shorter highlight videos (which only appear on YouTube).
Publishing ✅
Posting ❌
Sharing ❌
Interacting ❌
Following ❌
Saving ❌
Instagram | visualising.data
I’ve never been a big Instagram poster but set up the account in 2023 (from a dormant account set up in 2022 used to share podcast news) in order to explore Threads, which required an Instagram account to sign up. My intention for using Instagram is to post the occasional pics and/or video of life as an independent data visualisation expert, which might relate to both published work and more informal content.
Publishing ✅
Posting ✅
Sharing ❌
Interacting 🤏
Following 🤏
Saving ❌
Threads | visualising.data
Zuckerberg’s Threads platform – something of a Twitter-tribute – was launched in 2023 and after had a fairly rapid uptake it just as rapidly experienced a plateau, with useful features slow to arrive and new members stunted by the then-block on EU users. The latter has since been relaxed, to a degree, but the uptake has now continued. There are a bunch of people who have planted their flag in the Thread-o-sphere and so I’m going to persist with publishing links to my new content only, at this stage.
Publishing ✅
Posting ❌
Sharing ❌
Interacting ❌
Following ❌
Saving ❌
Mastodon | @andykirk
I set up a Mastodon account on the vis.social instance all the way back in 2018 when a growing number of that era’s Twitter diaspora were looking for a new place to call home. It never quite managed to lure a substantial volume of active users and, though I’m always thankful to folks who follow me and interact with me on there, I now only post published links to new content on my website or the occasional announcement linked to my work.
Publishing ✅
Posting 🤏
Sharing ❌
Interacting 🤏
Following ❌
Saving ❌
Blog posts
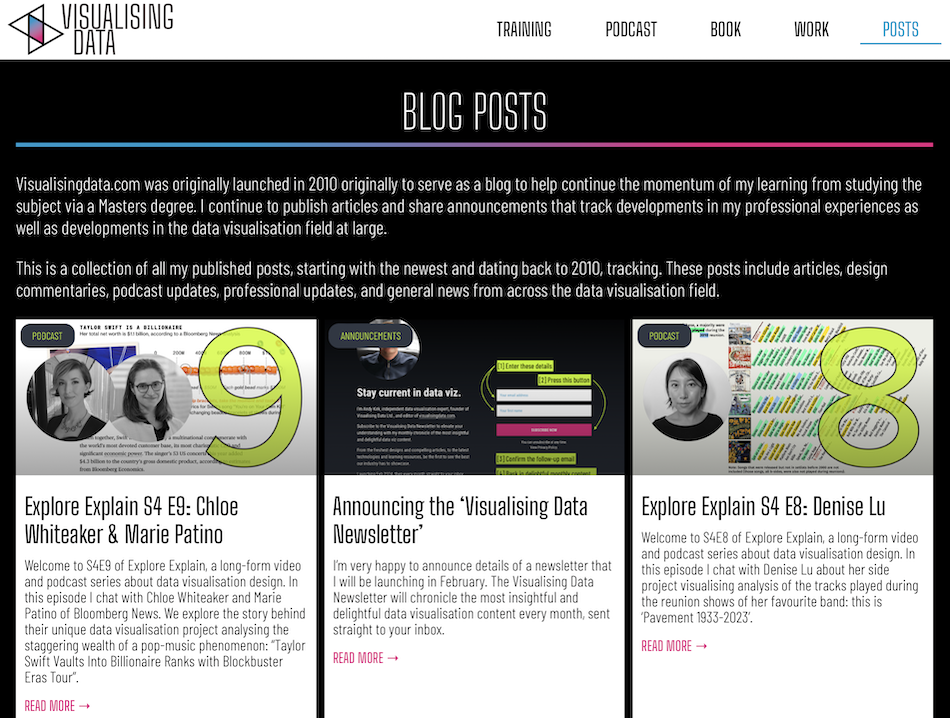
The most conventional way to check on new content and updates relating to my work is to go straight to the source, with my website visualisingdata.com and specifically my posts page.
Publishing ✅
Posting ❌
Sharing ❌
Interacting ❌
Following ❌
Saving ❌
RSS feeds | visualisingdata.com/feed
RSS feeds are making a comeback! Not all readers will know what these are, certainly not many of those who were brought up in the social media age. RSS stands for ‘Really Simple Syndication’ and is a way of receiving updates to websites, such as instances of new posts, in a “standardised, computer-readable format”. My blog posts have an RSS feed address that enables followers using feed readers to see my updates as soon as they are posted. I have recently resurrected my Feedly account to follow the RSS feeds of websites I am interested in but can no longer rely on seeing updates through following their social media accounts. Publishing ✅ Posting ❌ Sharing ❌ Interacting ❌ Following ✅ Saving ✅NOTE: I was asked about why I’d left out mention of how active I am and intend to ever be on the Data Visualization Society community Slack platform. The DVS slack has lots of great content, channels, and people on there, and I have interacted and posted from time to time. My sense of the purpsoe of any Slack environment is more aligned with messaging, I don’t really see it as a public platform in the same way as I see these listed above, where you have an account and/or some ‘page’.

