
I’m delighted to launch the latest episode in the third season of Explore Explain, a long-form video and podcast series about data visualisation design.
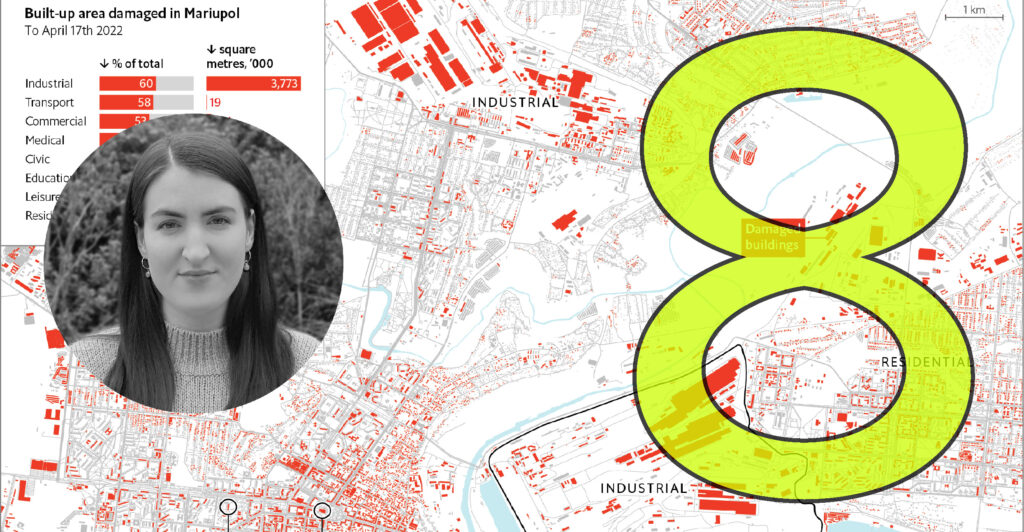
For this eighth episode it was a pleasure to welcome Ros Pearce, Visual Data Journalist at The Economist. We had a detailed conversation to explore the clever thinking behind an in-depth data study titled ‘Nearly half of Mariupol has suffered grave damage‘ looking at the early phase of the Russian invasion of Ukraine, published in April 2022.
To find out more information about how to listen, view and subscribe to the audio and video versions of this episode, and to view the full list episodes, visit the podcast page.
Video Conversation
You can watch this episode on the dedicated Explore Explain Youtube channel or through using the embedded player below.
You can also watch a short highlights package of this episode, focusing on five key insights to emerge from the conversation. This video is on the same Explore Explain Youtube channel or through using the embedded player below.
Audio Conversation
The audio podcast is published across all common platforms (such as Apple, Acast, Spotify etc.), which means you will find this series listed in the respective directories through a simple search for ‘Explore Explain’ or by manually entering – or copying/pasting – this url to your subscriptions – https://feed.pod.co/exploreexplain.
To listen directly, visit this link or use the embedded podcast player below.
