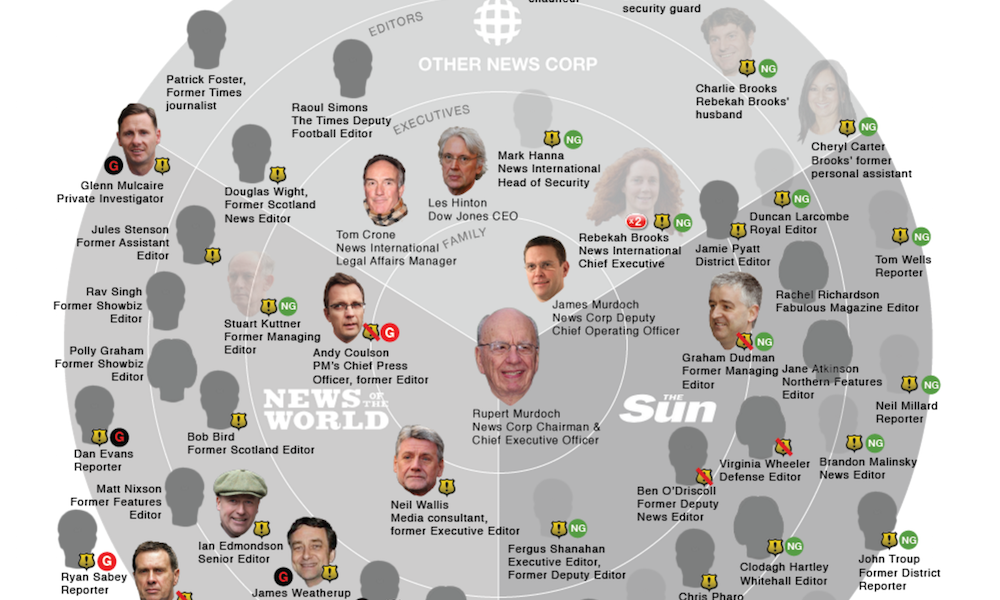
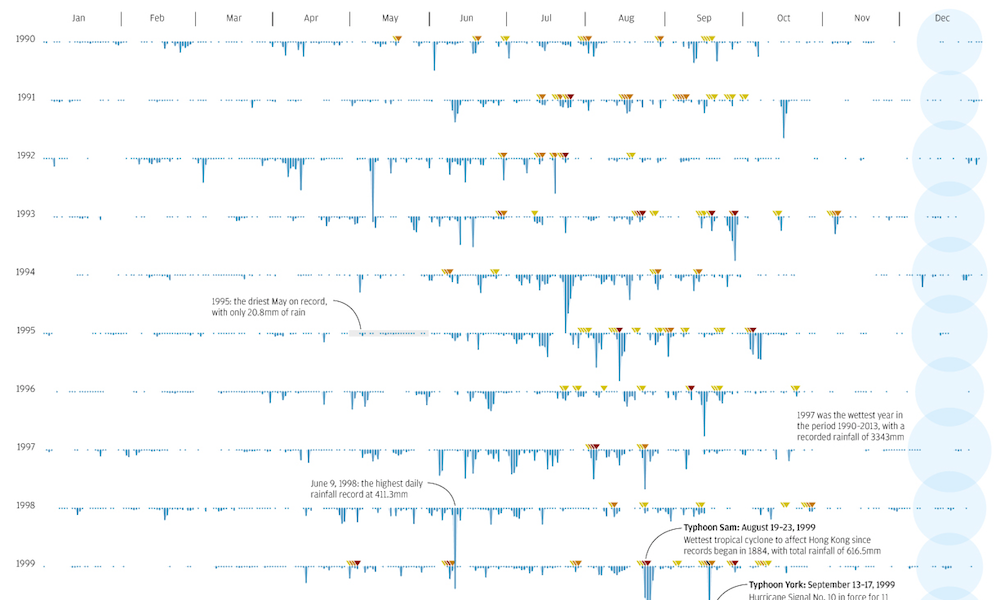
Summary of outputs from Seeing Data research
For the purpose of convenience, this is a collection of all the articles, posts and other outputs from the Seeing Data’ research work.
Summary of outputs from Seeing Data research Read More »
For the purpose of convenience, this is a collection of all the articles, posts and other outputs from the Seeing Data’ research work.
Summary of outputs from Seeing Data research Read More »
In order to sprinkle some star dust into the contents of my book I’ve been doing a few interviews with various professionals from data visualisation and related fields. These people span the spectrum of industries, backgrounds, roles and perspectives.
Six questions with… Jane Pong Read More »
In order to sprinkle some star dust into the contents of my book I’ve been doing a few interviews with various professionals from data visualisation and related fields. These people span the spectrum of industries, backgrounds, roles and perspectives.
Six questions with… Paolo Ciuccarelli Read More »
This is the third in a series of three blogposts about the Seeing Data project. In this final part I will be reflecting on our findings and considering some implications for visualisation designers.
Views from ‘Seeing Data’ research (Part 3) Read More »
In order to sprinkle some star dust into the contents of my book I’ve been doing a few interviews with various professionals from data visualisation and related fields. These people span the spectrum of industries, backgrounds, roles and perspectives.
Six questions with… Giorgia Lupi Read More »
This is the second in a series of three blogposts about the Seeing Data project. In this second post, I reflect on one of the research methods that we used, called ‘Talking Mats’, which we think offers some really exciting possibilities for measuring the effectiveness of data visualisations.
Views from ‘Seeing Data’ research (Part 2) Read More »
In order to sprinkle some star dust into the contents of my book I’ve been doing a few interviews with various professionals from data visualisation and related fields. These people span the spectrum of industries, backgrounds, roles and perspectives.
Six questions with… Jan Willem Tulp Read More »
In order to sprinkle some star dust into the contents of my book I’ve been doing a few interviews with various professionals from data visualisation and related fields. These people span the spectrum of industries, backgrounds, roles and perspectives.
Six questions with… Katie Peek Read More »
In order to sprinkle some star dust into the contents of my book I’ve been doing a few interviews with various professionals from data visualisation and related fields. These people span the spectrum of industries, backgrounds, roles and perspectives.
Six questions with… Nigel Holmes Read More »
Yesterday I posted on Twitter a set of colour swatch pairings that offer colour-blind safe alternatives to the default greens and reds often used. They are from the chapter in my upcoming book where I talk about the impact of colourblindness and the recommended alternatives to consider using. The colours shown were generated from the wonderful ColorBrewer website.
Colour swatch alternatives to green and red Read More »