
Invisible: Visible
I’ve had this draft post sat gathering WordPress dust for over 7 months so I thought it was time for it to be put out of its misery.
Invisible: Visible Read More »


I’ve had this draft post sat gathering WordPress dust for over 7 months so I thought it was time for it to be put out of its misery.
Invisible: Visible Read More »
At the end of each month I pull together a collection of links to some of the most relevant, interesting or thought-provoking web content I’ve come across during the previous month. Here’s the latest collection from May 2013
Best of the visualisation web… May 2013 Read More »
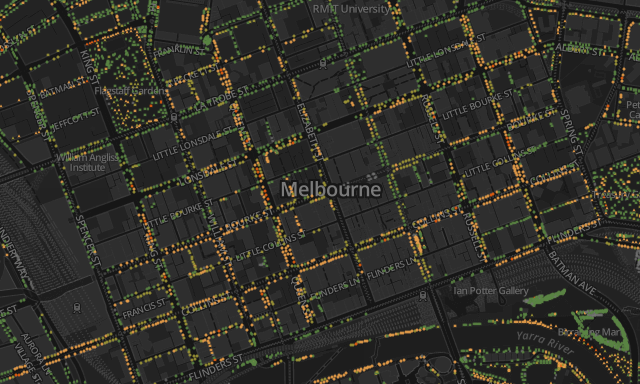
Came across some really nice work by Melbourne-based Greg More of OOM Creative. Titled ‘Urban Forest Visual’, the CartoDB powered project allows users to explore a dataset of the City of Melbourne’s 70,000+ trees and appreciate some of the issues being faced to maintain their life span.
Exploiting nature’s own colour palette Read More »
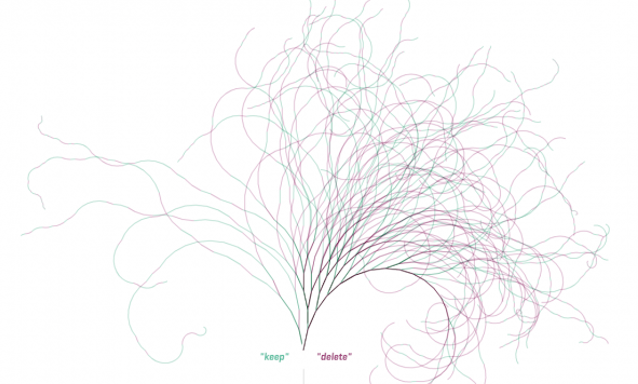
Before I begin, let me concede that there is a good chance that, by the time I get to the end, this post might not go anywhere, it might not hang together well and might be rather incohesive. It is my first day back after holidays and I’m not on top of my game yet.
A short essay about interpretation, doodling, perceptions and people Read More »
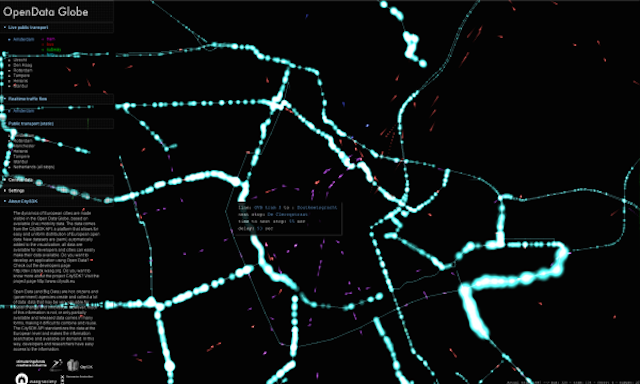
With the ever increasing availability of, and access to open data about the world around us, there is a constant stream of fascinating developments to try bring new insight into the dynamics of how our cities function.
‘OpenData Globe’ reveals dynamics of European cities Read More »
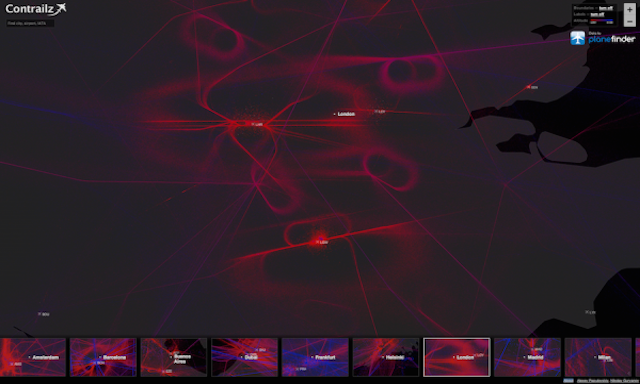
A nice new project brought to my attention by Alexey Papulovskiy titled ‘Contrailz’ provides an elegant visualisation of the world’s flight paths. Now, we’ve seen projects with a similar focus in the past (Bio.Diaspora and Arup, to name but a few) but here we have a fully interactive exploratory environment to zoom and pan around the global patterns.
‘Contrailz’ visualises flight paths around the world Read More »

After completing a logistics task comparable with the early Apollo missions, I have resolved my schedule for visiting Australia in November and can confirm the dates of my three training courses in Sydney, Canberra and Melbourne.
Data visualisation training dates for Australia: Registration open! Read More »
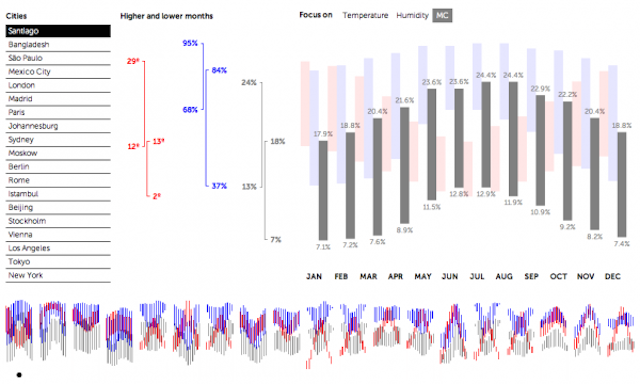
I have written in the past about the way those of us active in the field operate within something of an artificial environment. It is unavoidable and not unique to data visualisation but when your day is spent networking and communicating ideas largely just with other captive members of the discipline you do so within a bit of a bubble.
Appreciating the critical role of subject matter Read More »
Last month I invited those who might be interested to let me know of where in the world they would like me to arrange my ‘Introduction to Data Visualisation’ training courses. At the time I was specifically interested in exploring options for India and Australia but any location is of course feasible depending on the volume of interest expressed.
Announcing my planned training locations for Autumn 2013 Read More »
As we approach June there is just a month to go until Google Reader is shut down so this is another reminder that if you follow me via RSS you will need to make some changes. If you’ve not already done so, your first decision will be to choose a tool to replace the job of Google Reader.
A reminder about following this site via RSS Read More »