A few weeks have now passed since I launched the CHARTMAKER DIRECTORY, an attempt to gather and organise a useful catalogue of references that will offer a good sense of what charts can be made using which tools and, where necessary, how. Things have progressed nicely and so another brief update is due on the project’s status.
ENHANCEMENTS: A few technical enhancements have been made to the site. The occasionally jumpy transition scrolling down and across the directory has been resolved and this should now be nice and smooth. The chart type search box now brings back results for the ‘AKAs’, in other words, if you search for a chart name that is presented in this project as an alias, it will return the suggested chart type’s records. We have also added tooltip details for the colour legend as well as for the now-added ‘reference type’ key. The site is holding up pretty well so we are now content to evolve this from a beta to a full release.
TOOLS: The tools included have again evolved during the last period, I have added a couple of tool headings that were suggested to me as being useful homes/containers for references and removed a couple because there just seemed to be insufficient mileage in their inclusion. Again, let me emphasise that these are not reflective of all visualisation relevant tools (as you’ll see here), rather these are chart-making applications. Also, note that some columns represent consolidated headers so that related tools can fall under one tool ‘family’ (eg. Qlik is all Qlik products, same with Tableau, R is now R and all related packages and extensions).
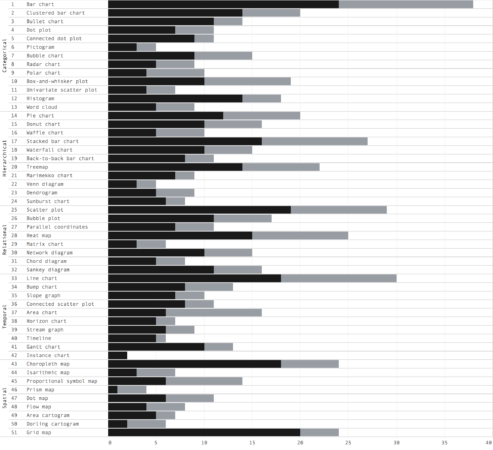
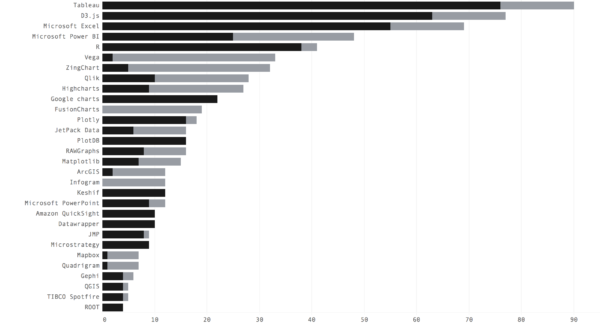
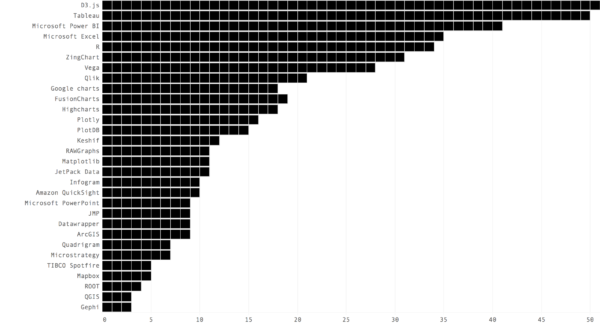
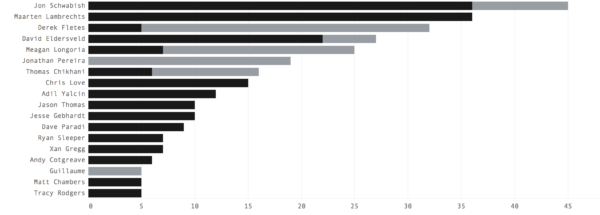
696 REFERENCES!: After the previous update there was another deluge of submissions that have now grown the number of references to 696. Thank you so much to all contributors and authors! Again, I would urge focus towards further references that help to plug the legitimate gaps in each column representing missing references rather than lack of tool capability. Take a look at the summary charts below (click for full view) and there are a few notable tools that seem to be lacking examples/solutions – who out there is a champion of each tool who can help boost their references!
NUMBER OF REFERENCES BY TYPE
NUMBER OF REFERENCES BY CHART TYPE
NUMBER OF REFERENCES BY TOOL
NUMBER OF DISTINCT CHARTS WITH AT LEAST ONE REFERENCE BY CHART TYPE (OUT OF 51)
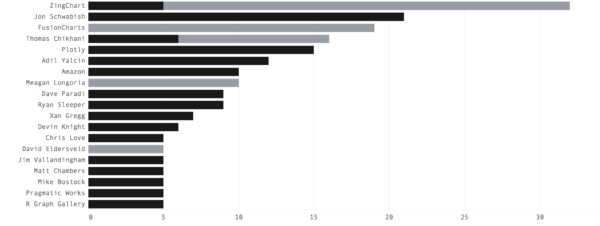
NUMBER OF REFERENCES SUBMITTED BY CONTRIBUTOR (More than 5, not including me)
NUMBER OF REFERENCES BY AUTHOR (More than 5)
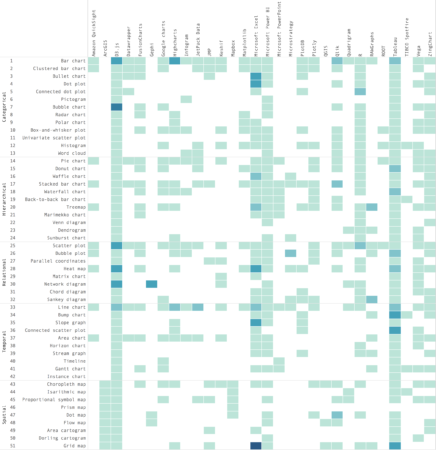
NUMBER OF REFERENCES BY CHART TYPE AND TOOL


