
I’m delighted to finally launch my latest and largest project to date. ‘The Seinfeld Chronicles: Digital Edition‘ is a rebooted digital version of my long-term visual investigation of the patterns of laughter, the interactions of characters, and the use of locations across every episode of ‘Seinfeld’.
This passion project/side quest originated in late 2016 with a curiosity about the possibilities of analysing the qualitative and subjective nature of situation comedy. Roll forward four years, in 2020 I produced a limited-edition self-printed book compiling all my analysis, with 176 copies (matching the number of written episodes of the show) made available on a pay-what-you-can-afford basis. These copies were snapped up within 2 weeks, far quicker than I could have ever imagined, and with such generosity: After covering the shipping costs, the net proceeds were donated to two charities, with Samaritans and Rainforest Trust each receiving £2500+.
With the work winning a coveted Malofiej-silver-medal, and with no desire to compromise the exclusivity of the product people had paid to obtain through a further print run, the project felt like it was done…
…except, I always had a nagging sense that it hadn’t quite fulfilled its ‘format’ potential having not been developed as a digital product for the web and therefore making it more widely accessible to different audiences.
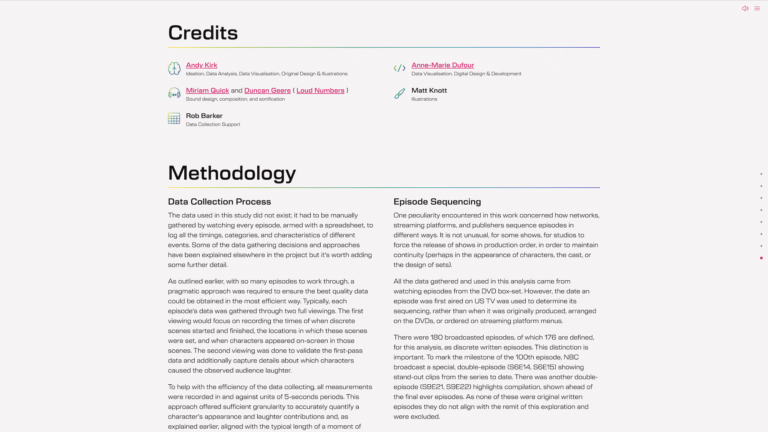
That’s where my approaching of the mega-talented data visualization designer and developer, Anne-Marie Dufour -and subsequent calling on the help of sonification superstars, Miriam Quick and Duncan Geere (from Loud Numbers) – has now led to a fresh, more ambitious digital reboot for this highly unnecessary data exploration.
The work is the consequence of a long term fascination with the creative process behind sitcoms and specifically Seinfeld. It was the ‘musicality’ of the show that I found particularly intriguing, orchestrated by the comedic talents of co-creators Jerry Seinfeld and Larry David.
Like music, situation comedy has rhythm and it has texture: rhythm is shaped by a show’s timing, its scene-structures, and its pacing; textures are created by the ‘instruments’ of characters and their locations, which amalgamate to create the situations from which the comedy manifests.
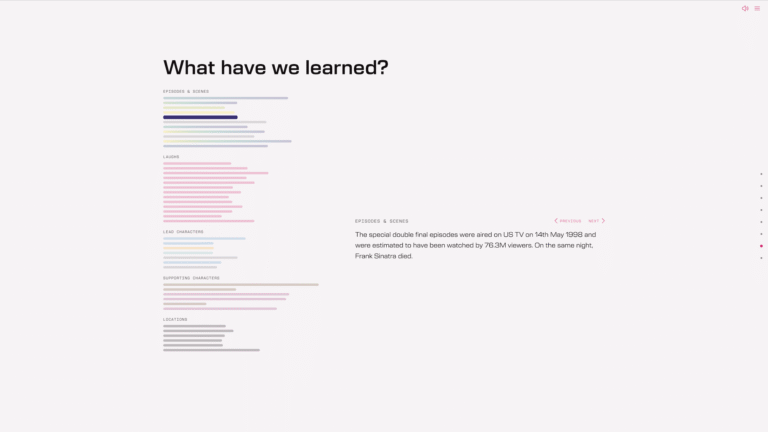
In this digital version we fully explore every possible avenue and level of visual analysis, from the macro trends of character, location and laughter patterns, right down to specific moments in each episode.
PROLOGUE
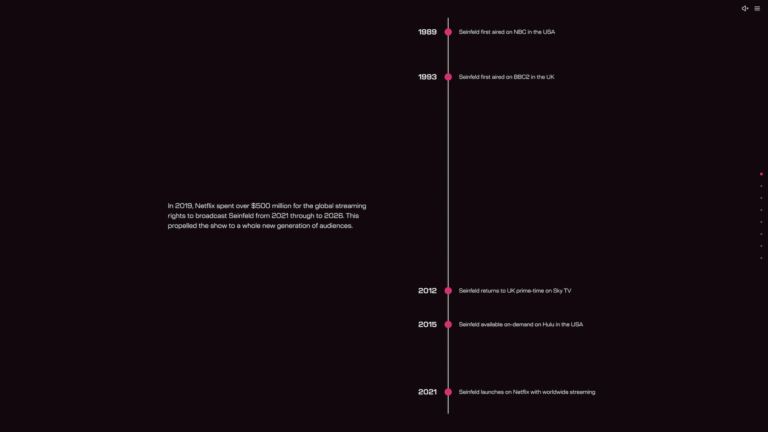
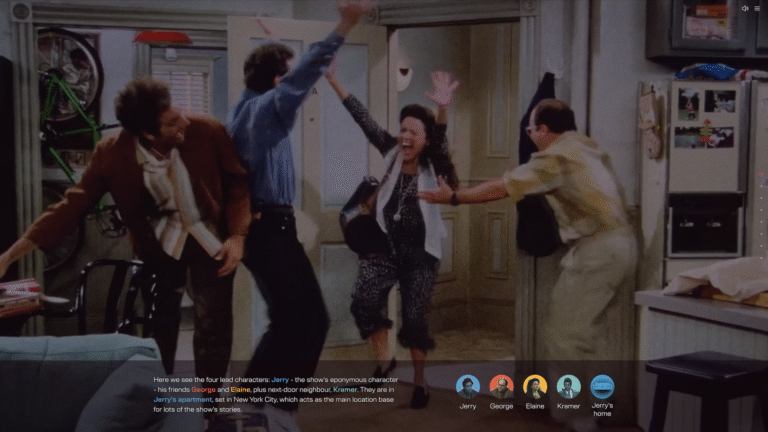
The project opens with my personal history with the show and the timeline of it being broadcast in different places on TV. We introduce the show, explaining its unique qualities, and also visually establishing the symbolic mapping system of characters and locations. We then move on to explain the motivating curiosity for this work – as well its print-version predecessor.
THE SHOW
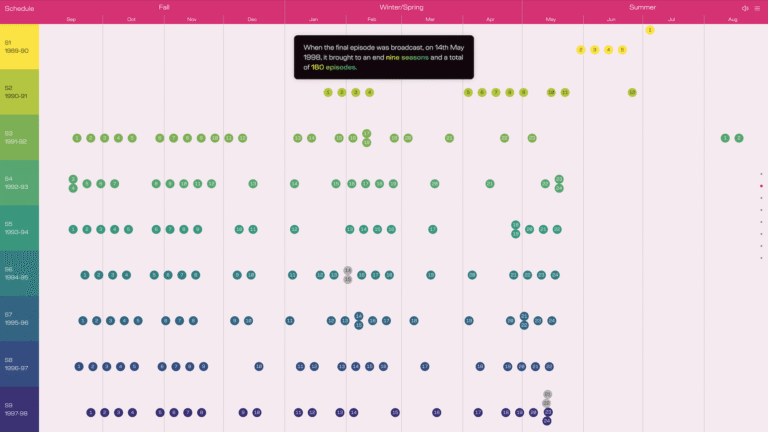
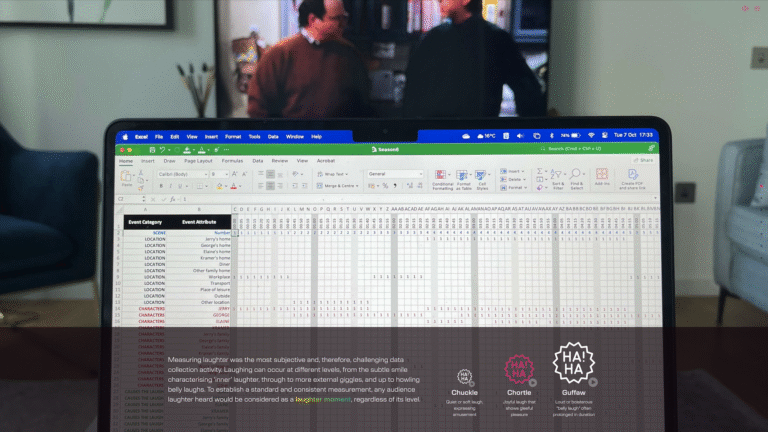
After the title page we introduce the shape, size and dimensions of the show with a timeline plotting ‘the when’ of the 180 broadcast episodes across 9 seasons. This sets the context for the scale of the data gathering that took place, the methodology behind which – especially in relation to the subjectivity of laughter – is then explained and illustrated with a worked-up scene.
EPISODE CATALOGUE
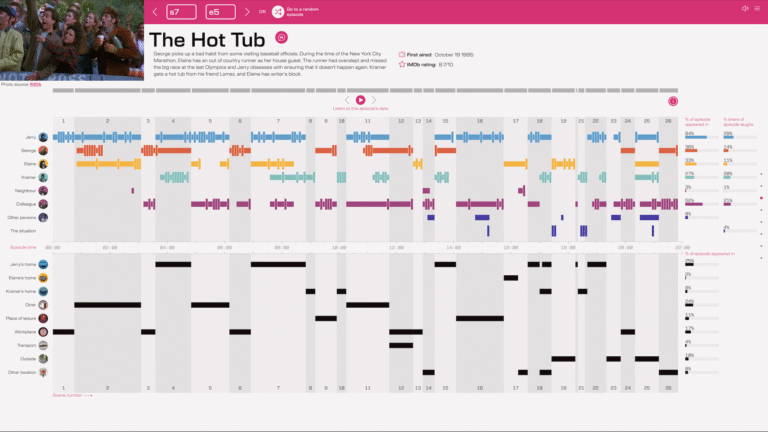
Having unveiled the components of the episode compositions, the centre-piece of the work, visitors can at this point explore a browsable gallery of all episode compositions with each offering a sonified representation of every scene, using instruments and sounds synonymous with the show to form unique jazz vignettes.
LEAD CHARACTERS
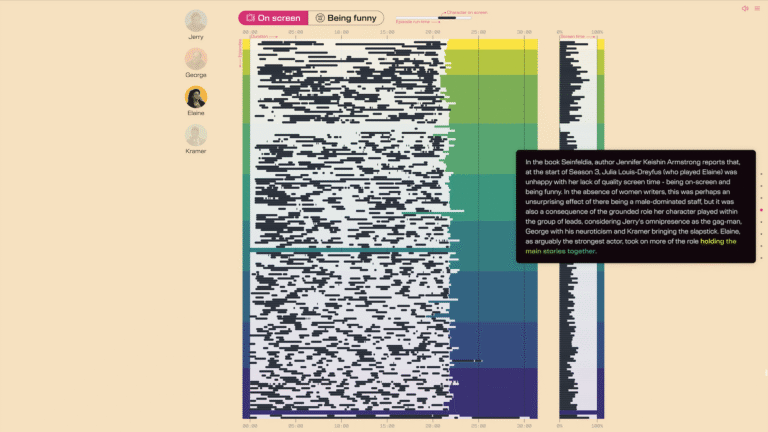
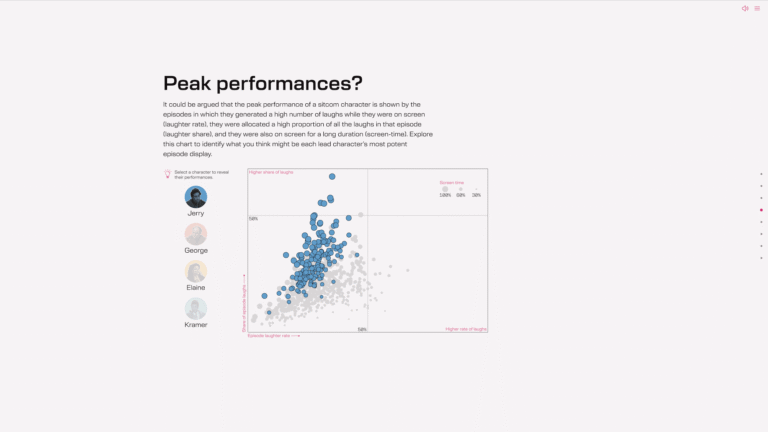
Focusing on the four main characters, we visually explore their patterns of screen time and laughter-causing across all episodes and seasons, with summary trends and observations of their potential peak performances.
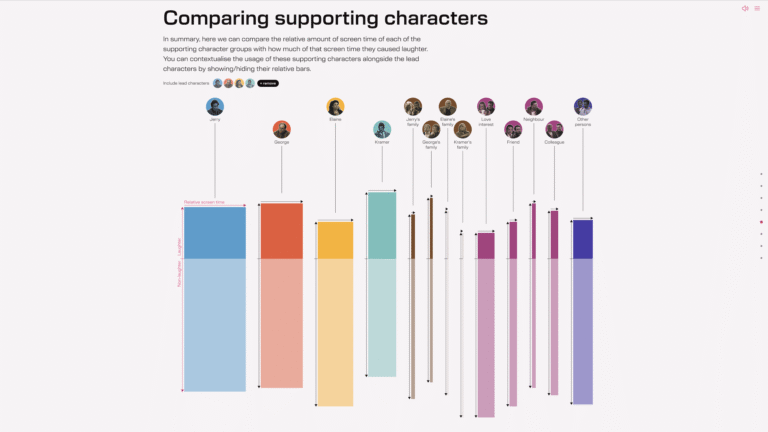
SUPPORTING CHARACTERS
Switching to all the other non-lead character groups, we again visually explore their patterns of screen time and laughter-causing across all episodes and seasons, with summary trends in the context of the leads.
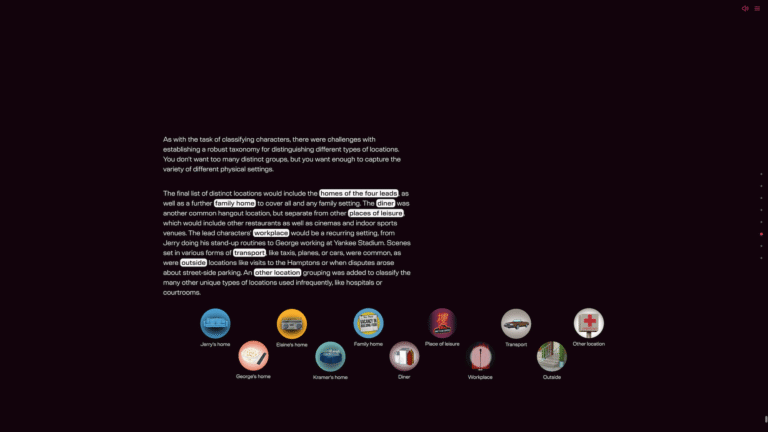
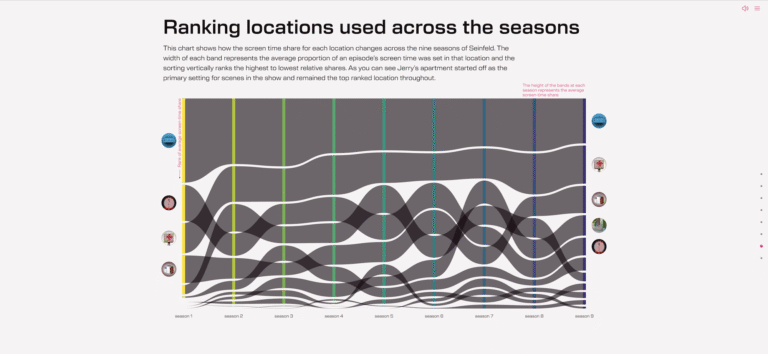
LOCATIONS
After characters, its the locations we examine to see their trends and patterns of usage as the setting of scenes through all the episodes.
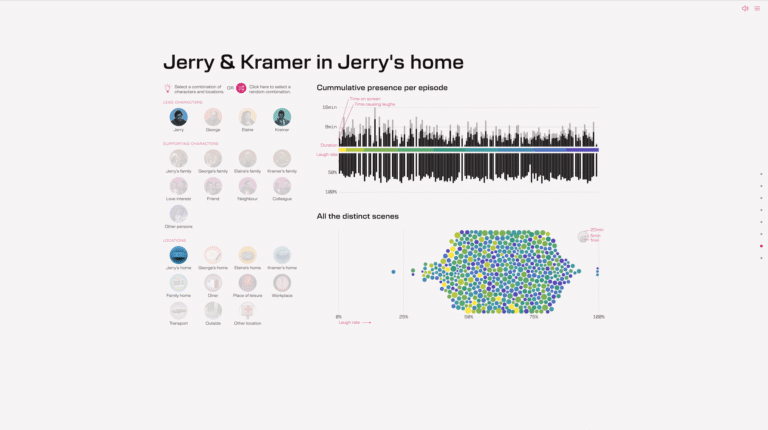
COMBINATIONS AND FINDINGS
Bringing it all together, here you’ll find an interactive tool to find out how often and when were different combinations of lead characters, supporting characters, and locations used across every episode. Supplementing this are some final written summary reflections offering general insights or notable factoids.
CREDITS & METHODOLOGY
Wrapping up the work is an appendix with remaining expanded details about aspects of the data gathering methodology, including established counting rules, assumptions made, and acknowledgements of accuracy. There are also final details of the sources of any video, audio, or image files used.
Want to know more about the behind-the-scenes development and creative process?
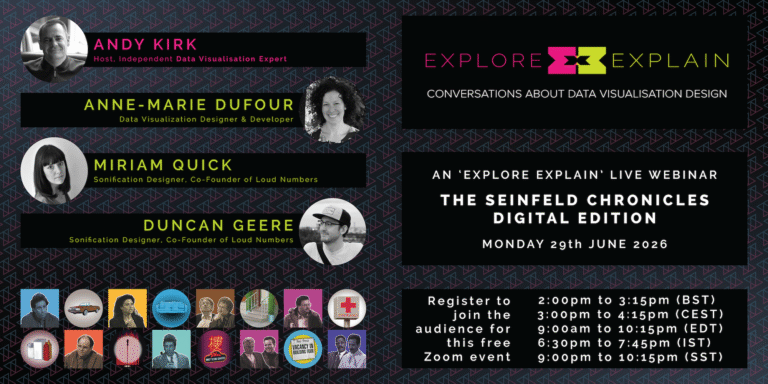
To coincide with the launch of this project, on Monday 29th June at 1pm UTC, I will host the final ever episode of my ‘Explore Explain‘ video and podcast series.
This will take the form of a live webinar, open to anyone to register to attend, and will be a detailed conversation between me and the team behind the work as we talk through and show our creative journey behind this long-term development.
Due to attendee limits I’ve set up a simple pre-registration using the following Eventbrite page where you can sign up for free. Once you do register you will be sent a confirmation by Eventbrite including a link to view tickets. 30 minutes before the event starts the webinar link will be revealed to enable you to join the session which will open at 1pm (UTC) and commence around 5 mins later. The conversation will last around 1 hour, with scope for audience Q&A.
I hope some of you can join us for this live session and participate in this final episode!
