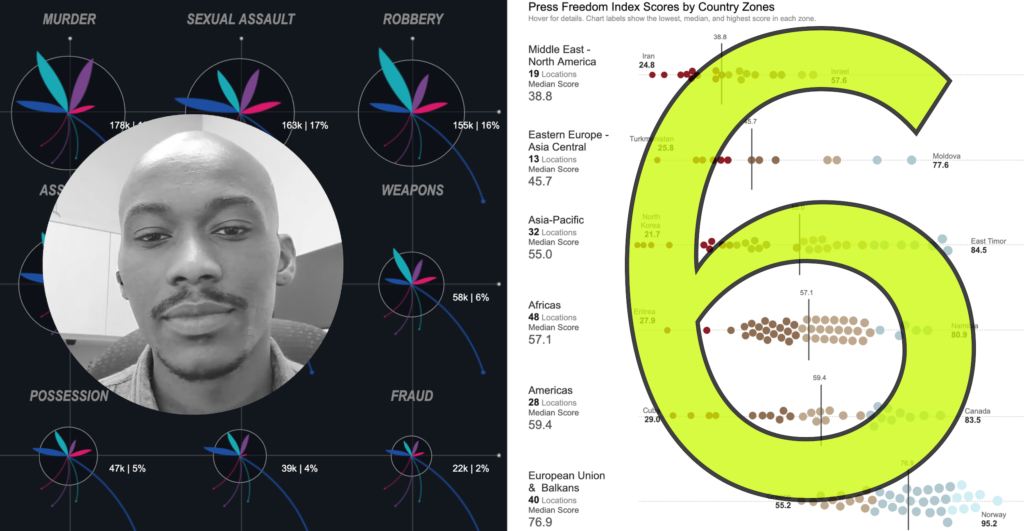
Welcome to the sixth episode of the fourth season of Explore Explain, a long-form video and podcast series about data visualisation design.
I am delighted to welcome Chimdi Nwosu, a Data Visualization Manager based in British Columbia, Canada. We explore the story behind not one but two of his wonderful Tableau-based data visualisation projects: ‘Incarcerated in America‘ (published August 2021) and ‘Press Freedom Index‘ (published May 2023).
Here are links to some of the key references or resources mentioned during this episode:
- Chimdi’s Tableau Public portfolio
- Guardian article ‘Media freedom in dire state in record number of countries, report finds‘
- Reporters Without Borders
- Chimdi mentions his appreciation for Tristan Guillevin’s AdvViz toolkit
Video Conversation
You can watch this episode using the embedded player below or over on the dedicated Explore Explain Youtube channel, where you’ll find all the other video-based episodes and curated playlists.
Audio Conversation
To listen directly, visit this link or use the embedded podcast player below. The audio podcast is published across all common platforms (such as Apple, Acast, Spotify etc.), so you will find this series listed in their respective directories by searching for ‘Explore Explain’ or by manually entering – or copying/pasting – this url to your subscriptions – https://feed.pod.co/exploreexplain.

