Welcome to the thid episode of the fourth season of Explore Explain, a long-form video and podcast series about data visualisation design.
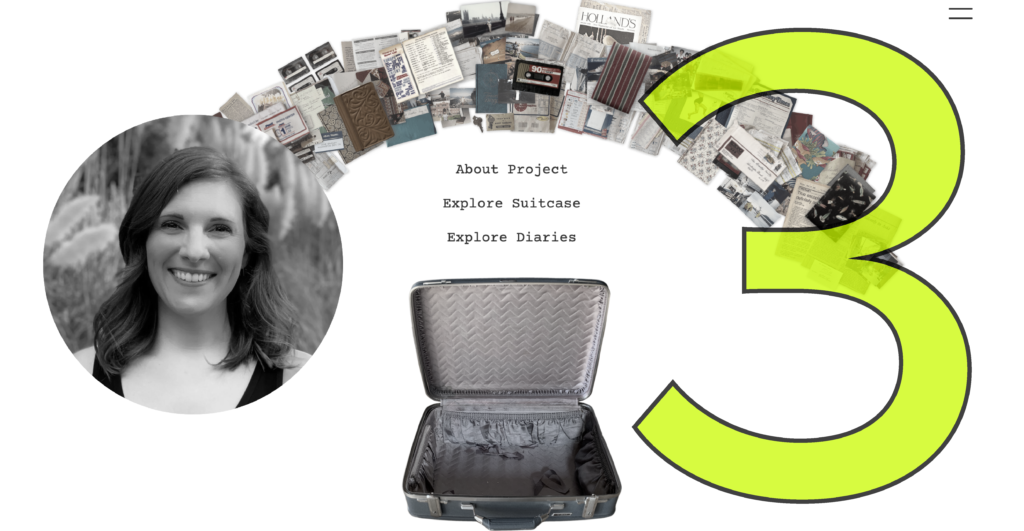
In this episode I am delighted to welcome Steph Bradley, a freelance designer based in Chicago, USA. We explored the story behind her work on the wonderfully charming ‘Traveling June Bug‘, Steph’s award-winning capstone project to visualise the objects, the diaries, the destinations, and the timelines across her Grandmother’s 30 years of documented travels.
Here are links to some of the key references or resources mentioned during this episode:
- Project homepage
- Steph’s homepage
- MICA’s catalogue of capstone projects from the ‘Data Analytics and Visualization (MPS)’ programme
Video Conversation
You can watch this episode using the embedded player below or over on the dedicated Explore Explain Youtube channel, where you’ll find all the other video-based episodes and curated playlists.
Audio Conversation
To listen directly, visit this link or use the embedded podcast player below. The audio podcast is published across all common platforms (such as Apple, Acast, Spotify etc.), so you will find this series listed in their respective directories by searching for ‘Explore Explain’ or by manually entering – or copying/pasting – this url to your subscriptions – https://feed.pod.co/exploreexplain.

