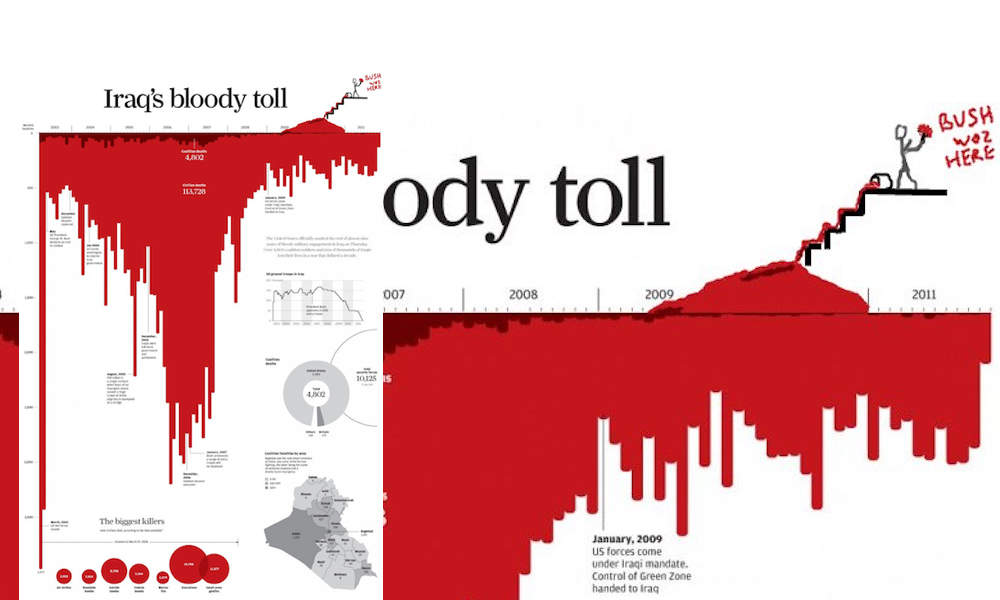
A couple of weeks ago I launched a small contest inviting folks to send me examples of graphiti – the clever ways can you think of combining the world of doodling and visualisation. The winner would receive a free copy of my upcoming book as soon as it is published. The contest closed on Sunday and I’ve now had chance to judge the entries.
Picking a winner was inevitably hard with lots of excellent submissions. I reduced the list down to a core group of finalists from which I eventually selected Chris Love’s graphiti treatment of the ‘Iraq Bloody Toll’ graphic which particularly appealed to me due to the similarities in concept with Slinkachu’s ‘Little People in the City’ work, that I mentioned in my launch post. Congratulations Chris!
Lets try that #graphiti again zoomed in! @visualisingdata pic.twitter.com/RSAAjQFNNz
— Chris Love (@ChrisLuv) March 1, 2016
A huge thank you to everyone else who entered a piece, there were several other submissions that came especially close in the final reckoning, I loved them all for different reasons but ultimately there has to be a winner. A special mention too for Nisa Mara for her excellent artwork. Keep you the great (legal) graphiti work!
.@visualisingdata will come up with something hand drawn later, but for now #graphiti pic.twitter.com/xE36CxqEm8
— Peter Gilks (@pgilks) March 1, 2016
Barcode viz to an obstacle course!
Super quick #graphiti @visualisingdata | Original viz; https://t.co/m1FFmqrlmh pic.twitter.com/gEqbZM01gt— Ravi (@Scribblr_42) March 1, 2016
Dog Agility Training on my birthday "leap shifting of the gregorian calendar" #grafiti @visualisingdata pic.twitter.com/5LUPa6ZQ1a
— Matt Knott (@JustAddDesign) March 2, 2016
.@visualisingdata for #graphiti – interactive visualizations need interactive doodles – right? pic.twitter.com/tEoyGnqVTb
— Jim Vallandingham (@vlandham) March 2, 2016
Hey @visualisingdata, check this #graphiti on some charts from our newspaper: https://t.co/XXgLVl0mVD pic.twitter.com/glUU3RDCvP
— Maarten Lambrechts (@maartenzam) March 2, 2016
.@visualisingdata I'm the panda eating pies, @Nisa_mara is the artist. pic.twitter.com/3zO8Qrm6CO
— David Pires (@davidmpires) March 2, 2016
Sorry to hijack your visual @NickatFP, but this one belongs to #graphiti @visualisingdata pic.twitter.com/fXWQs4O4cE
— Göktuğ (@stigamet) March 3, 2016
Hey @visualisingdata, the reason starwars ratings are higher @infobeautiful #graphiti pic.twitter.com/sjFwJdCGtR
— speedz (@speedy_e) March 3, 2016
My House is on #snowsmap! #graphiti @visualisingdata pic.twitter.com/ru0q0k0RzU
— Paul Chapman (@cheeky_chappie) March 1, 2016
The Tour de Graphs gets harder every year #graphiti @visualisingdata pic.twitter.com/kj3NPjuSrD
— Carl Allchin (@Datajedininja) March 1, 2016
@visualisingdata @SAGE_Methods Hey Andy, this immediately sprung to mind #graphiti #gapminder pic.twitter.com/5styX9fxzC
— Joe Lipski (@Joe_Lipski) March 1, 2016
Hey @visualisingdata, a nice slide here. Oh, you should have pay attention in your French class btw 😉 #graphiti pic.twitter.com/6qqgKt9UEg
— mathieu gallard (@mathieugallard) March 1, 2016
@visualisingdata first entry pic.twitter.com/FxgHBoSYSF
— David Pires (@davidmpires) March 1, 2016
@visualisingdata #graphiti turning a drink stain into something random pic.twitter.com/oS0xr95qOd
— Dallas Warren (@dr_dbw) March 2, 2016
A bit more #graphiti on today's #nytimes cover. @visualisingdata #tetris pic.twitter.com/LSrhmgPAS1
— Peter Gilks (@pgilks) March 1, 2016
Some financial #graphiti @visualisingdata pic.twitter.com/tmsJdgNhBu
— Luca Bardone (@luca_bard) March 2, 2016
@visualisingdata #graphiti "smeagol and data visualization" 😉 pic.twitter.com/aIsictSLTj
— Nisa_mara (@Nisa_mara) March 2, 2016

