Design
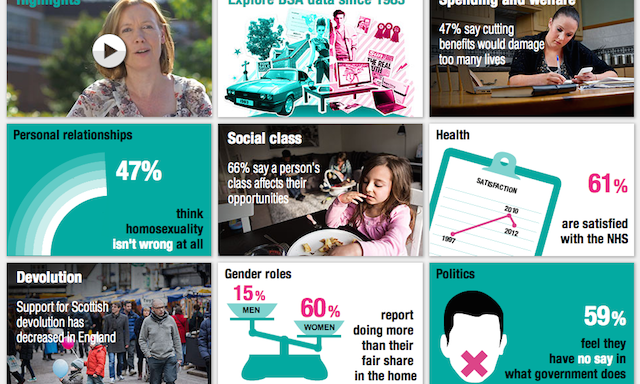
Changes in British social attitudes visualised over 30 years
Thanks to Mel Taylor for sharing some nice work from NatCen, a leading independent social research agency, revealing the changes in British social attitudes over 30 years.

Thanks to Mel Taylor for sharing some nice work from NatCen, a leading independent social research agency, revealing the changes in British social attitudes over 30 years.

The contents of this post are published on the interactive Resources page.
The contents of this post are now published on the interactive Resources page
The contents of this post are now published on the interactive Resources page
The contents of this post are now published on the interactive Resources page
The contents of this post are now published on the interactive Resources page
The contents of this post are now published on the interactive Resources page
The contents of this post are now published on the interactive Resources page
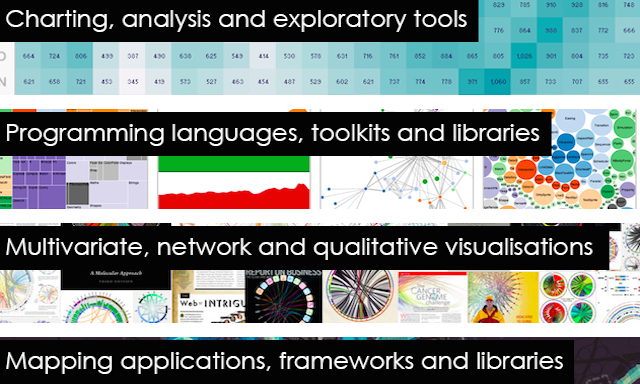
After what seems like an age since I started working on it, I have finally found the time to update my essential collection of visualisation resources, which was last published in 2011.
A fantastic new visualisation work has been released today titled ‘Kindred Britain’. Created by Nicholas Jenkins and Elijah Meeks of Stanford University in partnership with Scott Murray (amongst others) the project offers a deep, exploratory interface into a network of nearly 30,000 key figures in British culture.

At the end of each month I pull together a collection of links to some of the most relevant, interesting or thought-provoking web content I’ve come across during the previous month. Here’s the latest collection from July 2013.

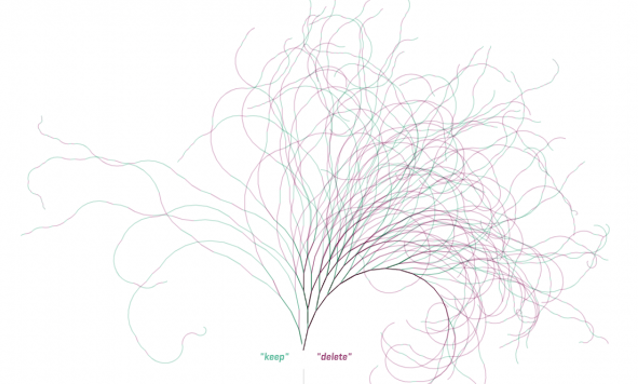
Dr Tony Rousmaniere PsyD is Associate Director of Counseling at the University of Alaska Fairbanks Student Center for Health and Counseling. Tony has been in touch to share details of some help is seeking from people with data visualisation skills to help work on a fascinating dataset around the clinical outcomes of psychotherapy cases.
The contents of this post are now published on the interactive Resources page

Just a short post to log and share a really nice video. Titled ‘What Color is a Glacier?’, it is a submission for a student context run by the American Geophysical Union (AGU), a ‘nonprofit organization of geophysicists, consisting of over 61,000 members from over 146 countries’.
To mark the milestone of each mid-year and end of year I try to take a reflective glance over the previous 6 months period in the data visualisation field and compile a collection of some of the most significant developments.
At the end of each month I pull together a collection of links to some of the most relevant, interesting or thought-provoking web content I’ve come across during the previous month. Here’s the latest collection from June 2013.
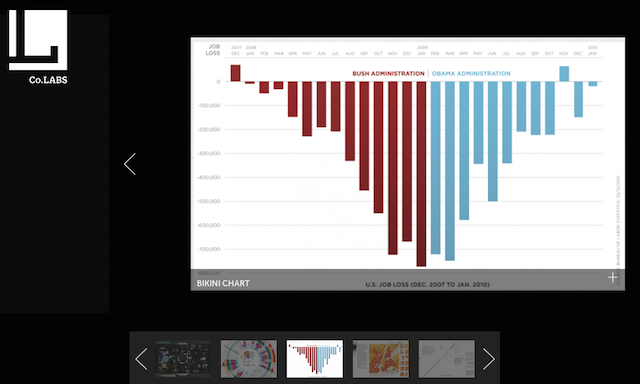
I was recently asked to contribute a selection of what I believe to be the five most iconic visualisations of the past 10 years for an article on FastCo Labs. The article has now been published and there are some really interesting other selections on there from Robert Kosara and Matt Stiles to make up a top 10 list.
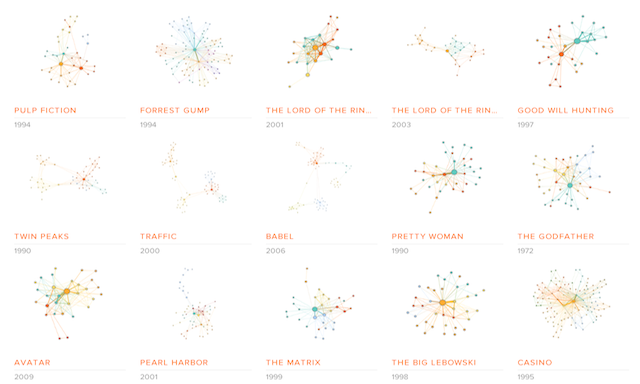
Jermain and Michael are co-founders of a data visualisation project called ‘Moviegalaxies’, “a place to discover the social graph in movies”. I recall I saw an early version of this project last year but it seems that the depth of movies now available has grown significantly.
The contents of this post are now published on the interactive Resources page

Thanks to Rob Rolleston for sharing this video with me. It came up through some analysis of the Hint FM Wind Map and, as you can see for yourself, it provides a mesmerising ambient display of local wind patterns, making the invisible visible.
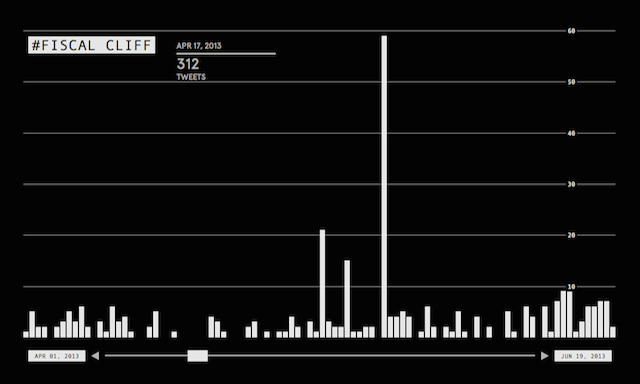
Many thanks to Luis van den Ende from Submarine Channel for sending me details of this fascinating interactive documentary titled ‘Unspeak’ that combines film, data visualisation, technology and design to investigate the issue of language that deliberately manipulates public opinion.
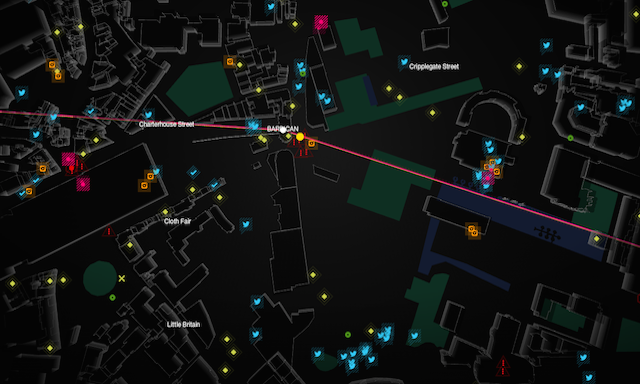
To accompany the launch of the Watch Dogs video game, ‘WatchDogs: WeAreData’ is a demonstration of some of the ‘smart cities’ concept that forms a major part of the game’s narrative.

Earlier today I came across a website that contained some incredibly intriguing data. The website is the Texas Department of Criminal Justice and the particular page of interest is a collection of records for the 500 ‘Death Row’ offenders who have been executed

Over on Fell In Love With Data, Enrico Bertini has started a really interesting conversation about the best way to teach data visualisation. This is in contrast to the majority of conversations that typically take place around how best to learn data visualisation.
Now that we have taken a confident stride into the second half of 2013, I thought it would be a suitable juncture to take stock of what I’m working on and share what is coming up in the remainder of the year.
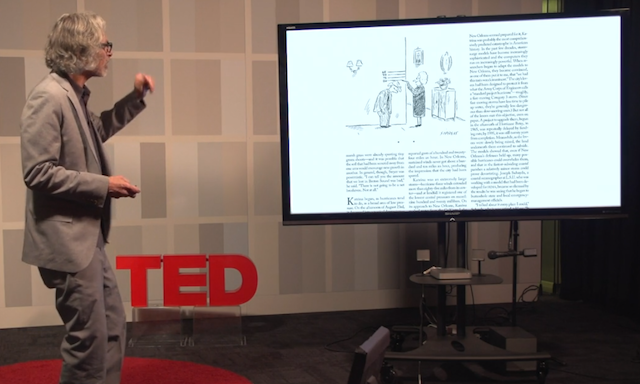
The shared principles and motives between visualisation and other forms or channels of communication always intrigue me. The craft of the cartoonist especially fascinates me.

I’ve had this draft post sat gathering WordPress dust for over 7 months so I thought it was time for it to be put out of its misery.
At the end of each month I pull together a collection of links to some of the most relevant, interesting or thought-provoking web content I’ve come across during the previous month. Here’s the latest collection from May 2013
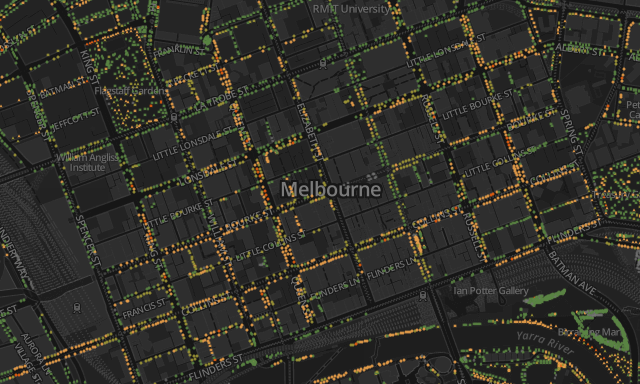
Came across some really nice work by Melbourne-based Greg More of OOM Creative. Titled ‘Urban Forest Visual’, the CartoDB powered project allows users to explore a dataset of the City of Melbourne’s 70,000+ trees and appreciate some of the issues being faced to maintain their life span.
Before I begin, let me concede that there is a good chance that, by the time I get to the end, this post might not go anywhere, it might not hang together well and might be rather incohesive. It is my first day back after holidays and I’m not on top of my game yet.