
Part 5: The essential collection of visualisation resources
The contents of this post are now published on the interactive Resources page
Part 5: The essential collection of visualisation resources Read More »

The contents of this post are now published on the interactive Resources page
Part 5: The essential collection of visualisation resources Read More »
A few weeks ago I published details of a data visualisation contest I had been invited to judge on. This was in relation to the then-topical issue of the population of black students at the UK’s elite universities. The winner of this contest was announced last week and I caught up with Swiss designer Raphaël
Interview with data visualisation contest winner Read More »
To mark the milestone of each mid-year and end of year I try to take a reflective glance over the previous 6 months period in the data visualisation field and compile a collection of some of the most significant developments.
10 significant visualisation developments: January to June 2011 Read More »
This is a follow-up post to my ninth article in the Visualisation Insights series which I published earlier this week. The purpose of this companion series is to optimise the learning opportunities from each insights article, reflecting on the ideas, issues and observations to emerge. Why did I choose this subject? I’ve been fortunate to
Visualisation Reflections: #9 Visual Journalist Read More »
One of the most interesting and inspiring consequences of running a website and writing a blog comes when you explore the geographical spread of visitors who view your content. At the last count, people from 177 different countries have visited my site since its inception at the start of last year. My global ignorance
Wanted! Data visualisation stories from around the world Read More »
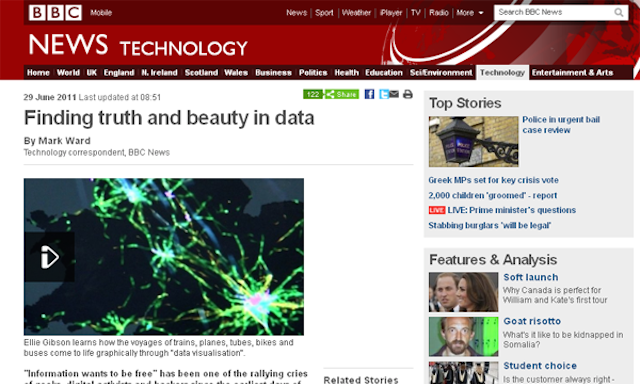
I was invited a couple of weeks ago to do some brief filming for the BBC. They were compiling a piece for the BBC Technology website about data visualisation and wanted my contribution to share some opinions about the key principles and better practices of this field.
BBC Tech – Finding truth and beauty in data Read More »
I am excited to share the news that I will be launching my public data visualisation training workshops in Autumn 2011. Initially, these 1-day introductory sessions will be available across the UK and Ireland, but I will be looking to spread the offering to Europe, North America and beyond during 2012. I am now collecting
Interested in attending a Visualising Data training workshop? Read More »
This is the ninth article in my Visualisation Insights series. The purpose of this series is to provide readers with unique insights into the field of visualisation from the different perspectives of those in the roles of designer, practitioner, academic, blogger, journalist and all sorts of other visual thinkers.
Visualisation Insights: #9 Visual Journalist Read More »
This week we have seen a great deal of buzz about Data Without Borders, a new project conceived by Jake Porway, a talented data scientist and member of the celebrated New York Times Research & Development team. Data Without Borders aims to establish a ‘data scientist exchange’, connecting up the expert community of visualisation and
Data Without Borders Read More »
The ongoing flow of data visualisation contests continues with the latest challenge from Visualizing.org focused on vulnerable populations around the World. I imagine some of you may be thinking ‘oh no, not another competition!‘, but the savvy ones amongst should you see this as another excellent opportunity to practice your skills, contribute positively to an
Latest Visualizing.org Challenge Read More »