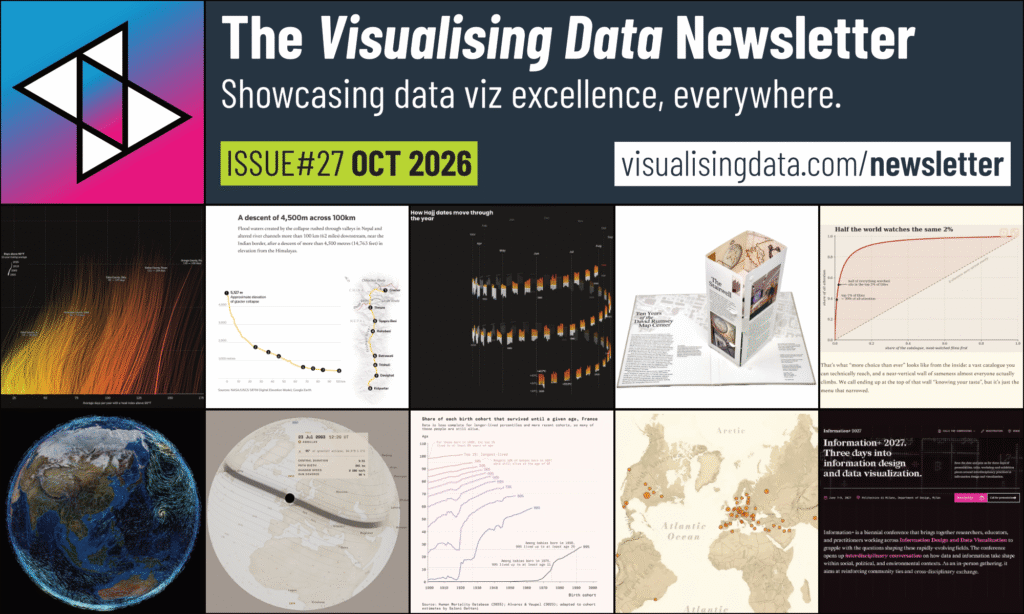
Welcome to the latest issue of the Visualising Data Newsletter, chronicling the most insightful and delightful data viz content.
Each month I collect, curate, and publish a collection of the best, most interesting, and thought-provoking data visualisation-related works I’ve encountered since the last issue. This latest collection relates to content I came across since August 2026.
Whether you are working on a dataviz, working in dataviz, or even working towards working in dataviz, you’ll hopefully find sources of inspiration and information. If you want to dive in deeper, browse through all previous issues on my Newsletter page.
To sign up for emailed notifications when each issue is published, subscribe here.
Happy Viz’ing!
Andy
LATEST FROM ME...
Some new stuff, recent posts or announcements relating to my professional services.
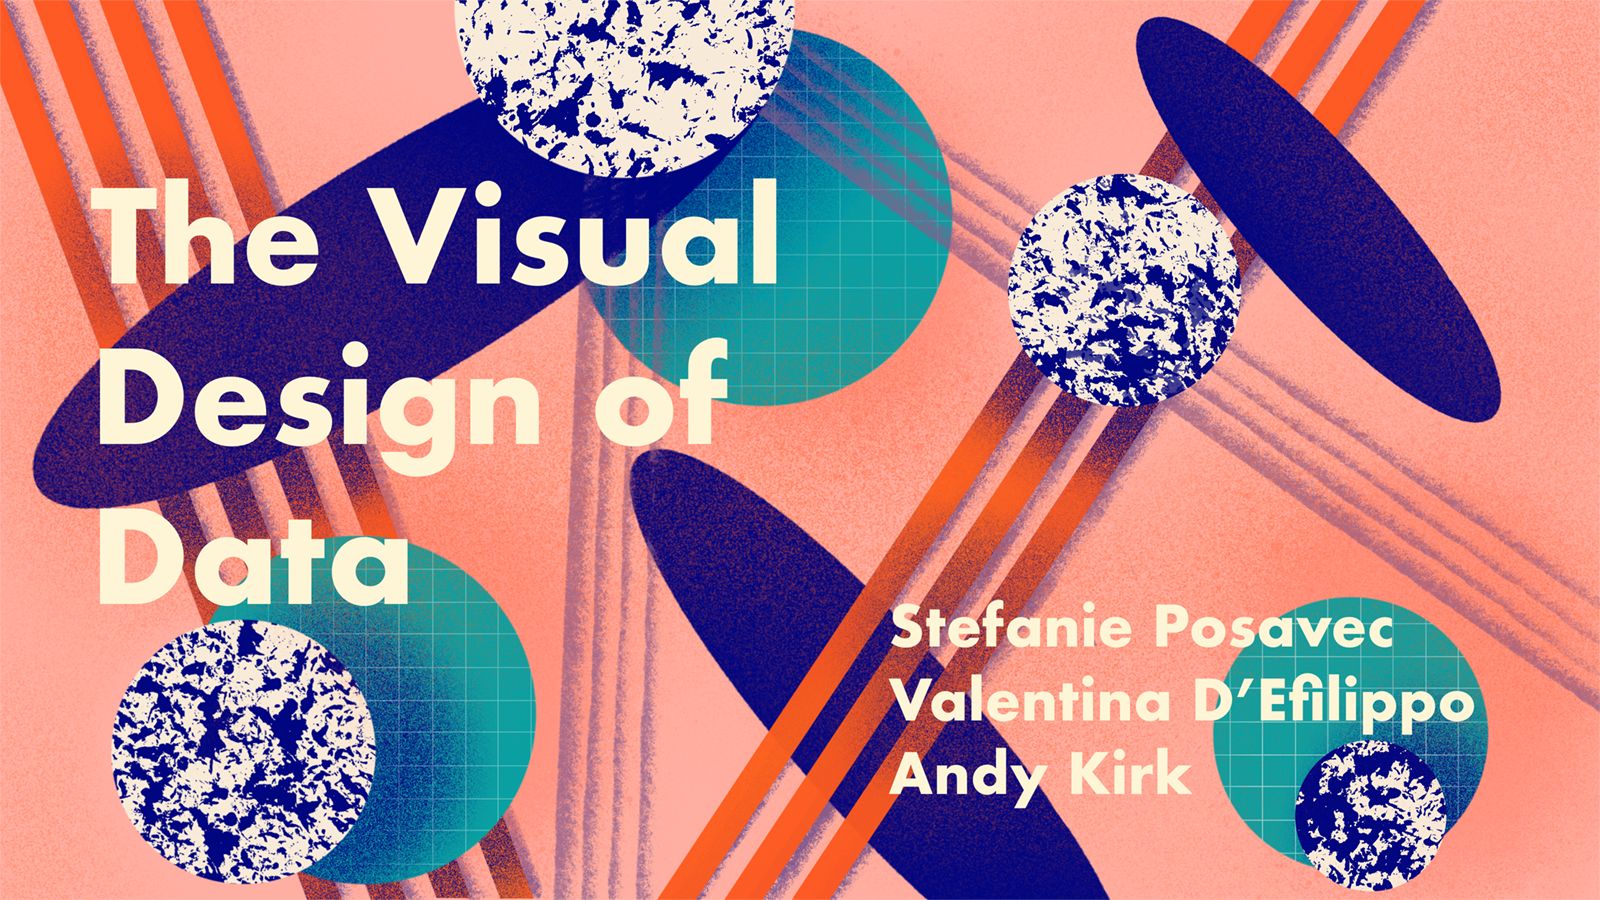
In a couple of weeks I have the distinct pleasure of reforming with my esteemed peers, Valentina D’Efilippo and Stefanie Posavec, to deliver a one-off online training course ‘The Visual Design of Data’. This will be run across 4 x four hour live sessions (17, 19, 24 and 26 November), with each of us taking a session individually before coming together for a final exercise activity to wrap all the learning together. Only a few places remain! Visit Graphic Hunters for more details and how to register.
For the first time in two years I am running a one-day ‘Fundamentals of Data Visualisation’ course taking place at Flourish HQ in London on Tue 24th November. This event is open to anyone and everyone to register, and includes the offer of two ‘pay what you can afford’ places. There are a few places remaining so visit the course page for more details about the course, the pricing, and information about how to register.
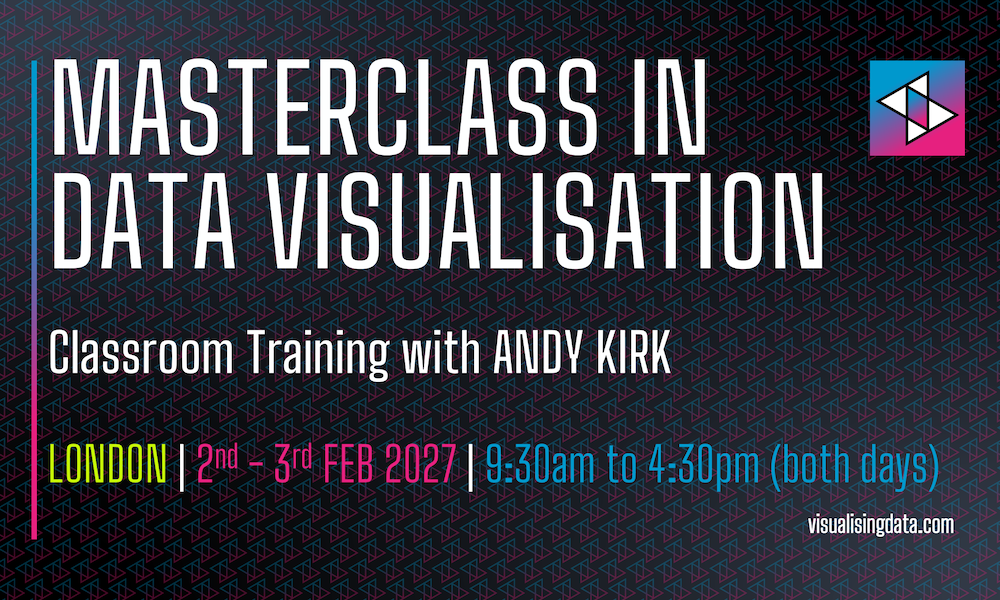
Finally, early in 2027 I will be running a 2-day ‘Masterclass in Data Visualisation’ training event, also taking place at Flourish HQ in London, over Tuesday 2nd and Wednesday 3rd February. Visit the course page for details about the course, the pricing, and information about how to register.
VISUALS
Some of the freshest data visualisation, visual journalism, or generally inspirational design works or collections.
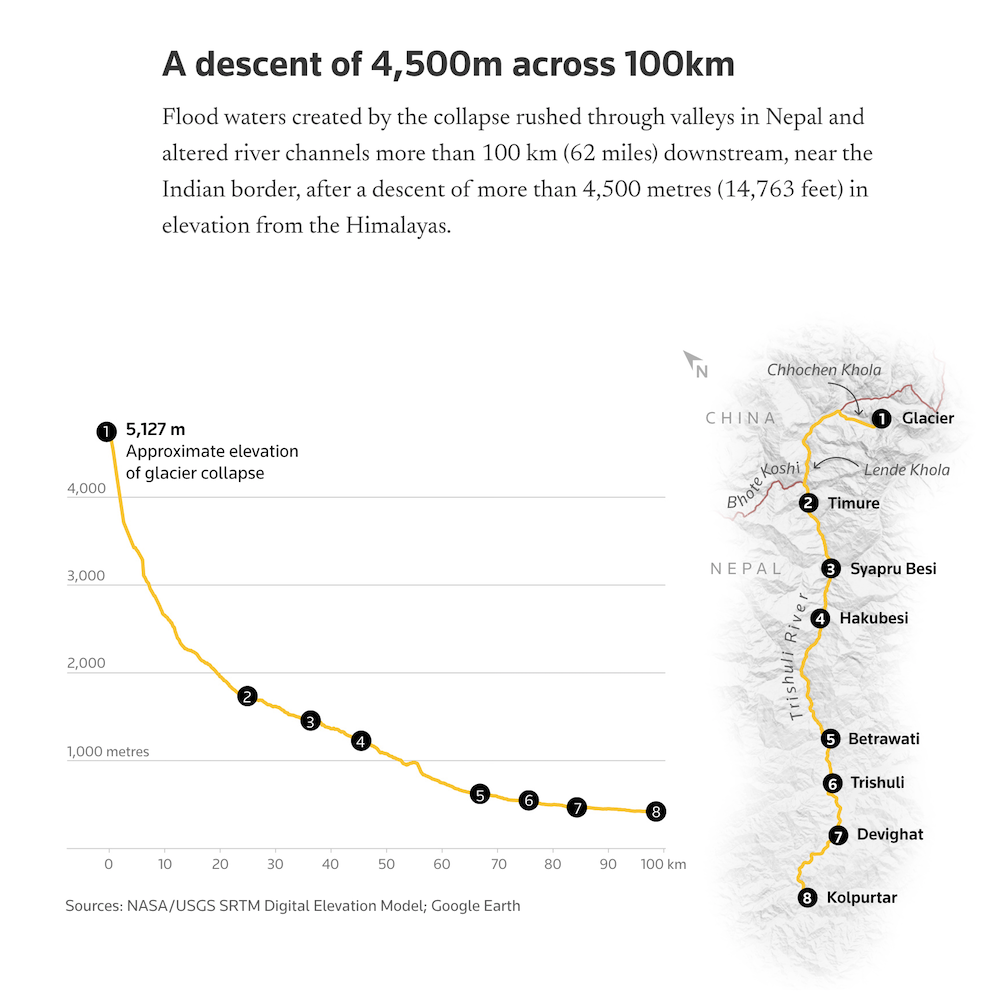
The title does a good job of describing what this about but within the article, which seems to have been a huge graphics-team effort to turn this around so quickly, there’s a perfect blend of visuals covering video clips, photo-imagery, annotated diagrams, maps, and charts to aid the understanding of this tragedy.
In 2013 the original version of this video went viral and represented, at the time, one of the most powerful cases for storytelling with visuals. 13 years later, here’s an updated version from the same original creator, the enigmatically named ‘Politizane’. Beyond this update, there are a further four video
Really elegant interactive relief map for exploring the terrain of the world.
Webernaut is a “small independent site for discovering interesting corners of the web” and includes a collection focused on data visualisation: interactive maps, visual explainers etc. which offers a nice growing resource of notable works in a single browsable place.
Really like the opening visuals that take real money away from an initial stack of cash representing a typical budget. Rather than abstracting the subject using (for example) stacked bar charts using images of Australian notes adds a layer of relatability.
Sound on for this lovely experiment by Josh Wolk. “Every dot is a real subway train. Eight hundred of them, give or take, form a small jazz combo (walking bass, piano, sax, vibes, brushes) that has been playing without pause for over a hundred years. On the platforms they are hot, screaming, full of complaint. This is the music inside the noise.”
LEARNING
Some of the latest articles, interviews, or videos about data viz or related matters.
I’m becoming ever more inclined to drift away from contributing to and obsessing over social platforms, and instead return to enjoying the web as it once was – more about visiting and discovering independent websites. Its always good to give a nudge to potentially new audiences to visit some of the OG data viz places, and so this month let me highlight Kaiser Fung’s long-standing Junk Charts site and his frequent smart observations about ways to refine visuals, that we can all learn so much from.
29. Outlier Conference 2026 - Youtube
NEWS & SUNDRIES
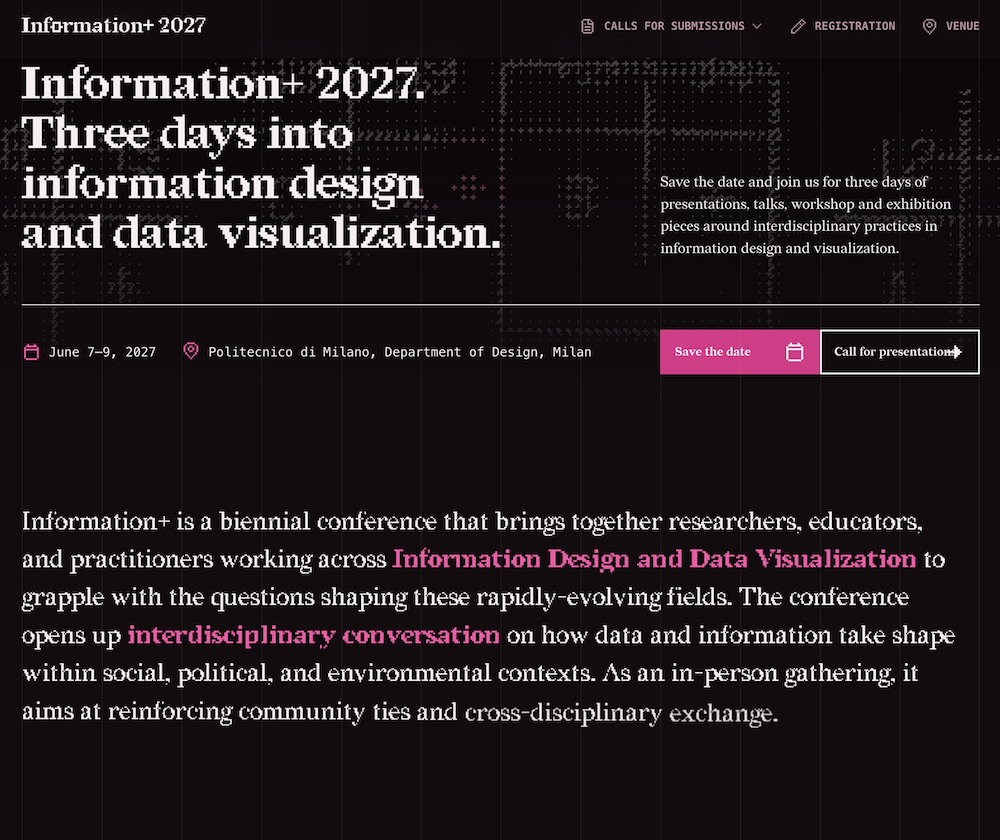
An exciting announcement to hear that the Information+ Conference – I might argue for it being the best on the data viz circuit – is scheduled to run in Milan over 7-9 June 2027. I’m definitely going to be there.
With the 25th anniversary of September 11th landing during this period, here’s a photographic essay from Jonathan tracing his life through those 25 years since 9/11: “I became a journalist, got leukemia, raised two children and took more than 30,000 photographs of New York City after 9/11.”
Came across this via Nathan Yau, “Relive some of your favorite classic game franchises in a whole new way with Hand-Drawn Game Guides free fan art filled PDF guides”
‘Line’ a fun tool to create your own pottery family based on a single curve: “Draw the curve, Line generates a whole family of proportional vessels, ready to export at real scale (SVG/PDF/STL). Free, in the browser.”
Read the exec summary and then access (for members) the full report to learn about the current trends in the data viz field.