Long before we had Google Calendars or birthday notifications on social media, humans used the stars to track time. The twelve zodiac constellations, which form the basis of modern astrology, were originally data markers for the passage of time. Ancient civilizations noticed that certain star patterns appeared in the sky at specific times of the year, helping them create seasonal calendars that informed farming, navigation, and yes birth dates.
The Babylonians, around 3,000 years ago, were the first to divide the sky into twelve sections, each aligned with a star constellation. These celestial markers later evolved into what we now recognize as zodiac signs, each linked to different birth months. So, in a way, constellations were the original data viz for birthdays, a cosmic infographic written in the stars.
Star Signs as Data Clusters
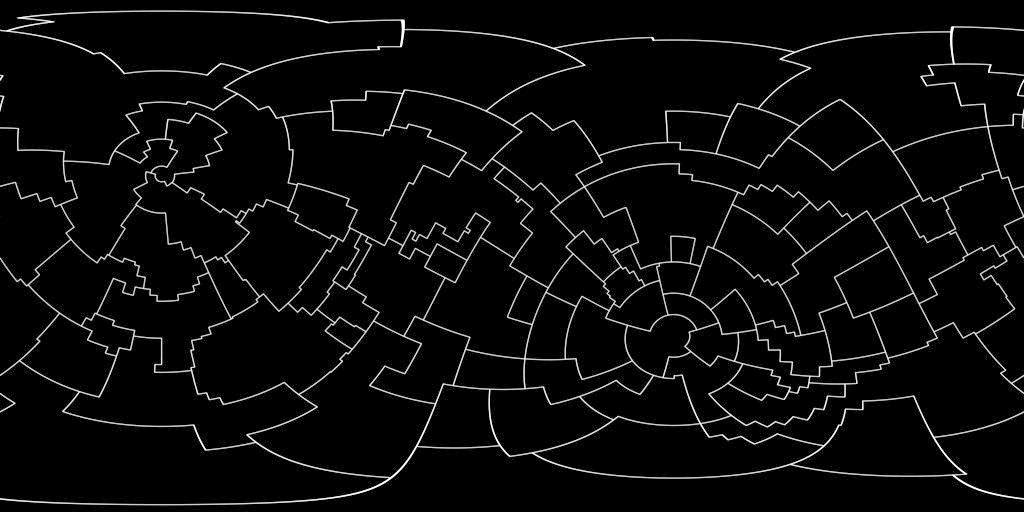
Whether or not you believe in astrology, zodiac signs are a great example of how humans have grouped and visualized large sets of birth data over centuries. Each zodiac sign clusters people born within a particular date range, forming a kind of categorization system, one that just happens to be mapped across the night sky.
From an information design perspective, the way astrology divides people into different personality types is similar to how modern data science groups users into segments based on behavior patterns. Think about it:
- Just like horoscopes assign traits based on birth months, data analytics clusters consumers into personas for targeted advertising.
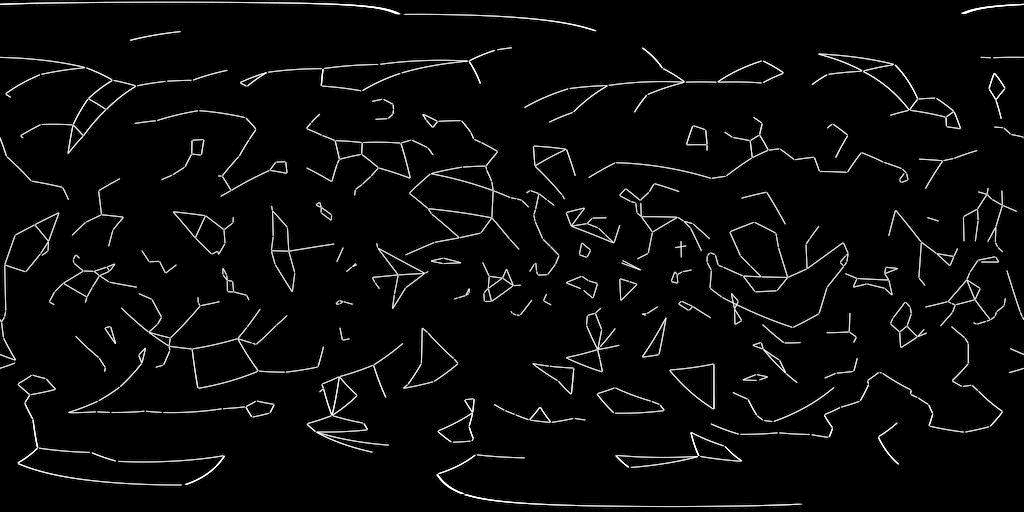
- Just as constellations organize the sky into recognizable patterns, we organize datasets into meaningful visual insights.
Ancient civilizations may not have had dashboards or algorithms, but they were already using the stars to structure, track, and communicate seasonal cycles and human life events.
A Celestial Data Dashboard
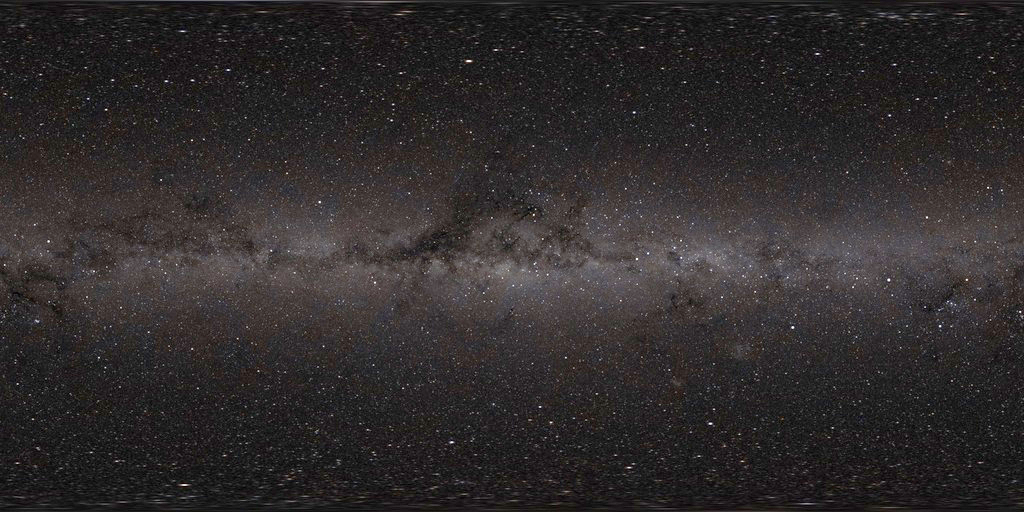
Looking at the stars today, it’s fascinating to think of them as a giant natural dataset, a visualization tool that has guided civilizations for millennia. Whether for tracking time, planning harvests, or mapping birthdays in a VR experience (which I may be featuring here in the near future), constellations remind us that data visualization isn’t just a modern invention; it’s been shaping our understanding of the world long before we had screens and spreadsheets.
So, the next time you look up at the night sky, remember: you’re staring at one of the oldest, most beautifully mapped datasets in history. And if you have no one else to celebrate your day with, there is a star out there shining just for you
See you next time when we uncover more Data in the Wild!