What follows is some analysis about football – Premier league football specifically – and is motivated by my dislike – no, let me raise that to hate – of draws. Some regular readers may wonder if they’ve landed on the wrong website but we’re going to see some charts soon so that does keep it on-brand.
I hate draws
The context. As a Liverpool fan, so far enjoying a very good season overall, during the past six league games we’ve had 3 draws. Each game had a different narrative and context to it (slow starts, red cards, good comebacks, late concessions, late misses) but had form and quality come to the fore, my opinion would be that ahead of each game we would have been expected to win.
Draws hurt. This is partially the consequence of living through the agony of several extremely tight league races over recent years up against Man City. In each tight race, we lost by quite narrow margins. Those narrow margins essentially caused by drawing too many games.
Since 1981 when the English league system moved to a points basis of 3 points – rather than 2 points – for a win, the value of winning a game to a team’s prospects in the league has inevitably increased.
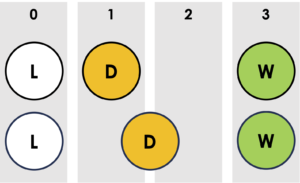
In the graphic below the first row shows the points totals allocated, since 1981, to teams who lose, draw or win.
Draws can hurt but I don’t think they hurt enough people enough.
Since this switch to 3 points for a win, I’m not convinced there has been enough of a related shift in mindset in how damaging not winning – through drawing – is to a team’s season.
The second row of the graphic above shows my rather blunt estimation of my perception that some fans/teams seem to disproportionally ‘feel’ the value of a draw is better than the points reality. It feels some people see draws as almost being midway in their value between winning and losing.
Don’t get me wrong, in certain game states or fixture contexts a draw can feel good. And maybe this is not so much about seeing draws closer to the feeling of winning but more about a lost game triggering a disproportionately worse feeling than a drawn game when, ultimately, only 1 point has been missed out on.
"Sharing" the spoils?
Hating draws is where my mind state was when something occurred to me. Going back to the basis of the league points system, in all league fixtures, when the match begins there are potentially 3 points available for a team to gain. Over a full season, that equates to a maximum of 114 points possibly available to each team. For the Premier League with 20 teams this means there are 1140 total points up for grabs.
Let’s go overly simplistic for a moment. When a match results in a victory for a team, there is a winner and a loser, with the loser getting zero points and the winner getting three points. For the benefit of what follows below let me illustrate this outcome like this:
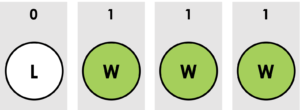
When a match results in a draw both teams get 1 point so let’s illustrate this outcome similarly.
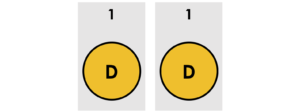
Here’s the thing. Commentators often summarise drawn games as ‘sharing the spoils‘.
"In football if you say share the spoils, you mean both teams share the points or glory – they draw the game"
But do both teams share ‘the points’? No they don’t.
Are the points equally divided to both teams? Not really. They do end up with the same number of points – 1 each – but there were 3 points available when the match begun – they don’t each get 1.5 points.
So what’s happened to that ‘lost’ third point?
The 'lost' drawn points
This is where my analysis and charts kick in. I wanted to explore the idea of inverting points gained to instead look at points lost. Not through teams losing matches but specifically these ‘lost’ third points that don’t go to any teams when a draw happens.
For this I decided to allocate the lost third point to the ‘Premier League’.
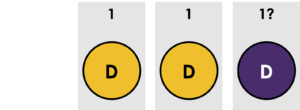
By analysing how many draws occurred across each season I could work out the imagined total points accrued by the ‘Premier League’ from these otherwise unclaimed, unallocated, ‘lost’ points. In 1996-97 there were 119 draws, with 2018-19 having the fewest (71). That means the ‘Premier League’ would be allocated 119 points for the 1996-97 season and 71 points for the 2018-19 season.
I would then add these totals into each season’s final standings to understand not just what quantity of points ‘go missing’ each year because of drawn matches, but also to see how successful this imagined extra team would be in the simulated league tables.
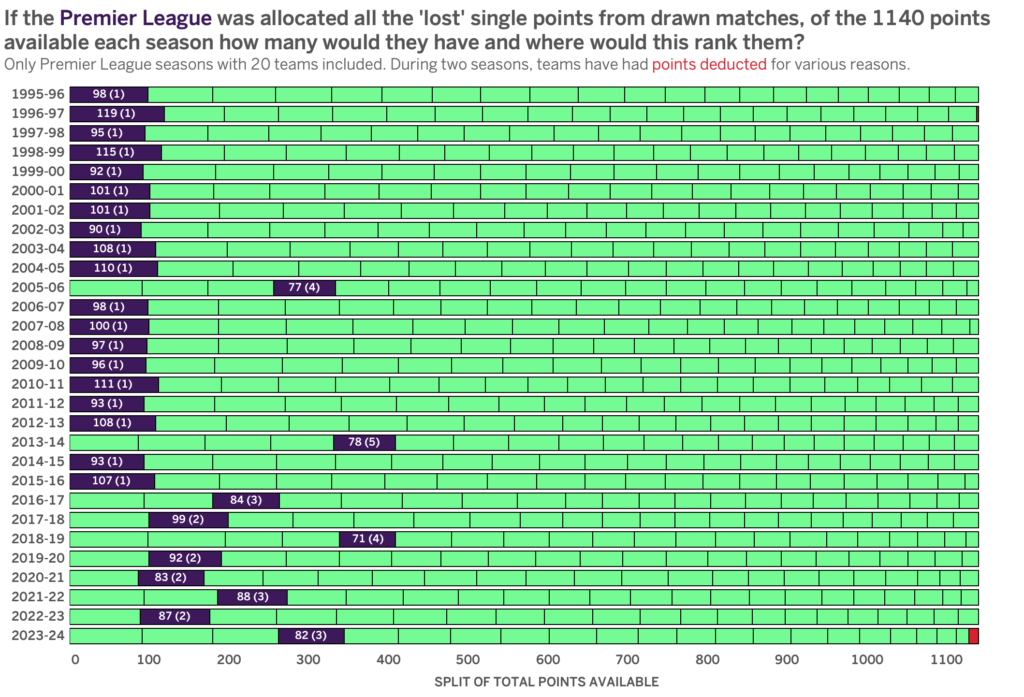
The first analysis looks at the total points available in any given season – 1140 – and the split of points each team (which from now on will be considered to include the 21st team of the Premier League) achieved.
The stacks are sorted from the largest on the left to the smallest on the right, which means – as you can see – had the ‘Premier League’ been a team, they would have amassed so many points in most seasons up to around 2015-16 to have easily won the league title.
* In the 2018-19 and 2023-24 seasons the ‘Premier League’ finishes with the same points as another team, so they have equal rank but from a layout perspective left-to-right I’ve prioritised the real team.
What this chart also clearly shows is a change, from the mid 2010s onwards, whereby the number of draws has been noticeably lower. In this modern era, where once a total in the 80s would have been sufficient, now it typically needs a total somewhere in the 90s to have the best chance of securing the league.
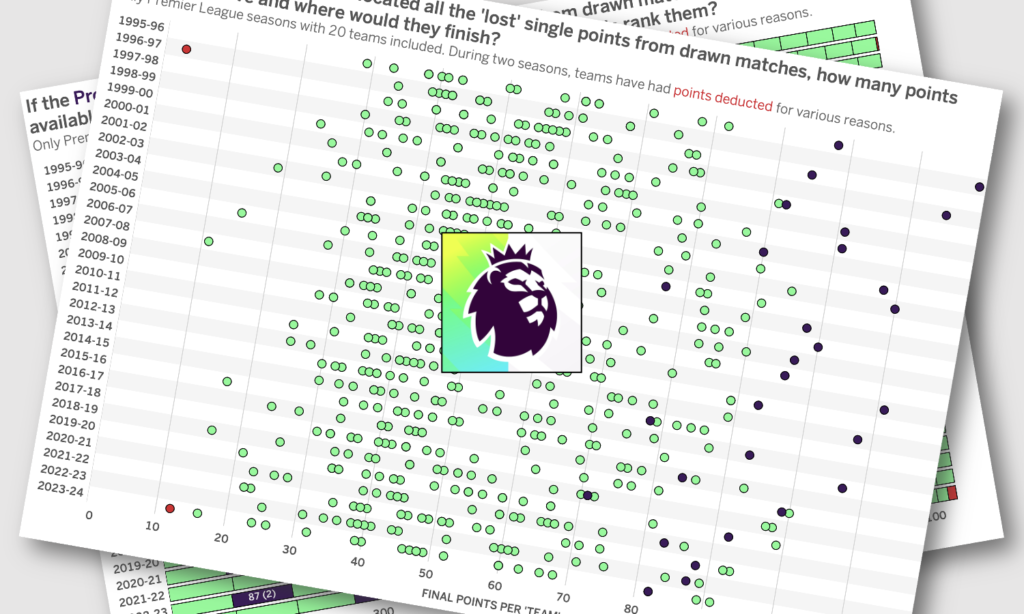
This is shown clearly in the second chart which uses a dot plot to place all the teams’ final points totals each season, fewest on the left to most on the right. This better reveals the spread in range of points, the concentration and the outliers.
It is understood that Man City and Liverpool (and recently Arsenal) especially have pushed the points totals required to win the title so high. But elsewhere across the league it seems there are more matches with winning outcomes than ever before, which perhaps contradicts my sense that football teams (at least, if not fans) are content to settle for draws.
(It also shows in 2023-24 how close the worst team, Sheffield United, were to being matched by the number of points deducted from teams (Everton and Nottingham Forest) for various misdemeanours.)
* Note that there are many instances where a team finishes with the same final points total as another team so you may not always see 21 dots per row. With more vertical space to play with I would have used a beeswarm plot.
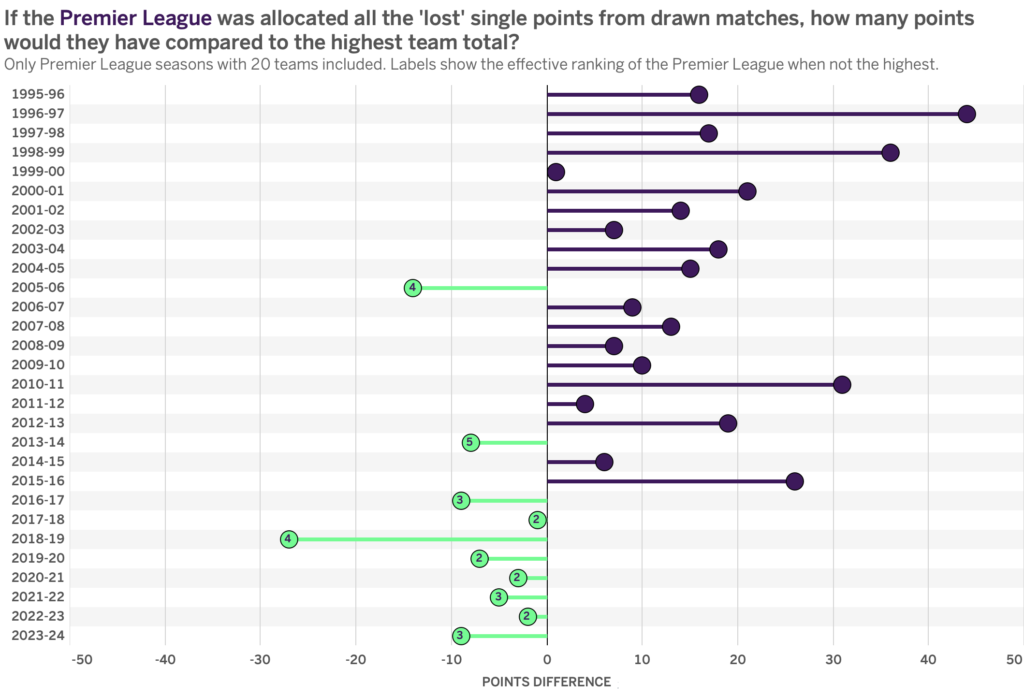
The third and final chart summarises the difference between the ‘Premier League’ team’s notional allocated points and the points total of the highest real team.
The huge numbers of drawn matches in 1996-97 – for which the concentration of points shown across all teams is so visibly narrow – far exceeds the highest points tally of the actual winners that year, Man Utd (75). The reverse story is shown in the comparative points totals since 2016-17, with the green lines indicating how much lower the number of drawn points were compared to the best team totals.
My conclusion therefore is that, unexpectedly, it seems my dislike of draws is more widely shared than I perceived because thankfully they seem to be going slightly out of fashion. It will be interesting to see if this trends continues this season and beyond.

