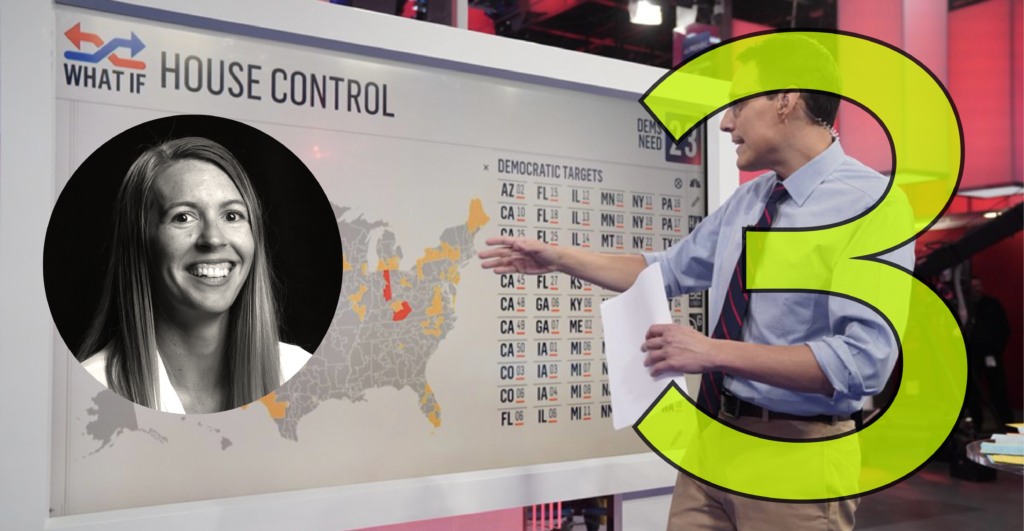
Welcome to the third episode of the fifth season of Explore Explain, a long-form video and podcast series all about data visualisation design.
In this latest episode I am delighted to welcome Natalie Erdem, Managing Partner and Product Manager at TWO-N, based in New York City. We explore the story behind TWO-N’s development of the MSNBC Election Big Board, the dynamic visualisation tool used by National Political Correspondent for NBC News and MSNBC, Steve Kornacki during the live broadcast of the 2018 US mid-terms and subsequent elections.
As well as listening to this show, you can watch the video of this conversation. Head over to Youtube and visit the Explore Explain channel.
Video Conversation
You can watch this episode using the embedded player below or over on the dedicated Explore Explain Youtube channel, where you’ll find all the other video-based episodes and curated playlists.
You can also watch a short highlights package of this episode, focusing on five key insights to emerge from the conversation. This video is on the same Explore Explain Youtube channel or through using the embedded player below.
Audio Conversation
To listen directly, visit this link or use the embedded podcast player below. The audio podcast is published across all common platforms (such as Apple, Acast, Spotify etc.), so you will find this series listed in their respective directories by searching for ‘Explore Explain’ or by manually entering – or copying/pasting – this url to your subscriptions – https://feed.pod.co/exploreexplain.

