Welcome to the eighth episode of the fourth season of Explore Explain, a long-form video and podcast series about data visualisation design.
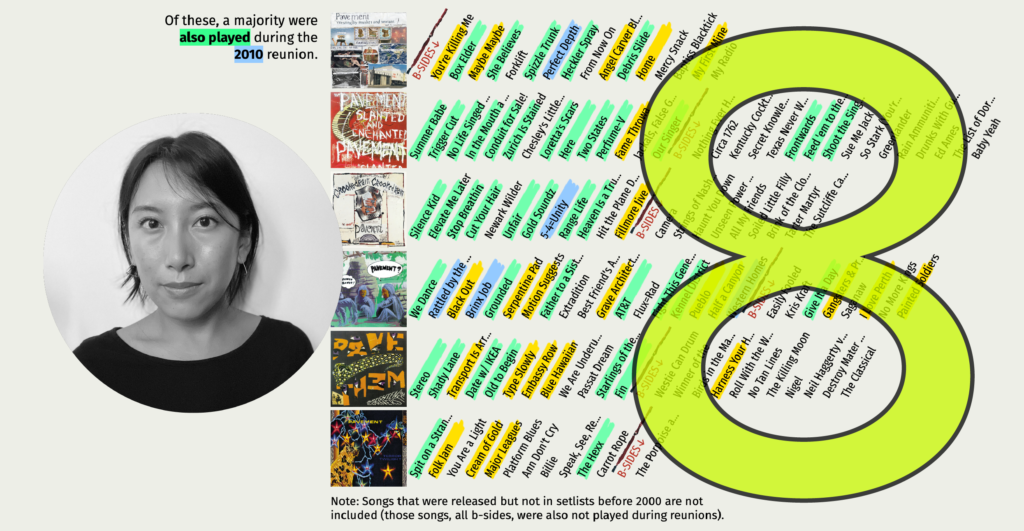
I am delighted to welcome Denise Lu, Graphics reporter at Bloomberg News, based in New York City. We explore the story behind her side project visualising her analysis of the tracks played during the reunion shows of her favourite band, Pavement. The day before this episode was launched, it was announced that this project had won ‘The Pudding Cup’ 2023 gold prize – congratulations to Denise!
Here are links to some of the key references or resources mentioned during this episode:
- The main project ‘Pavement 1933-2023‘
- Denise’s twitter thread launching the work
- Setlist.fm, the source of much of the data
- Denise’s previous work for the New York Times ‘The Hidden Melodies of Subways Around the World‘
- ‘There are 2,373 squirrels in Central Park. I know because I helped count them.‘
Video Conversation
You can watch this episode using the embedded player below or over on the dedicated Explore Explain Youtube channel, where you’ll find all the other video-based episodes and curated playlists.
Audio Conversation
To listen directly, visit this link or use the embedded podcast player below. The audio podcast is published across all common platforms (such as Apple, Acast, Spotify etc.), so you will find this series listed in their respective directories by searching for ‘Explore Explain’ or by manually entering – or copying/pasting – this url to your subscriptions – https://feed.pod.co/exploreexplain.

