This is the final guest/cross-post by Jan Willem Tulp, winner of my recent contest to win a full pass to the O’Reilly Strata conference. The conference has been taking place this week and Jan has kindly offered to share a short summary on each day of the conference. You can find out more about Jan’s work via his blog and follow him on Twitter @JanWillemTulp.

Day 3 at O’Reilly Strata Conference
The third day of the Strata Conference was again packed with great sessions. The day started off with numerous keynotes. The first one was Simon Rogers of The Guardian. Simon is not just a fabulous presenter, also the examples of his work at the Guarding were great examples of how to tell stories with data, and how The Guardian actually enhanced its news stories by sharing data with the public. Next up was an interesting panel discussion with Toby Segaran ( Google), Amber Case (Geoloqi) and Bradford Cross (Flightcaster) and moderated by Alistair Croll (Bitcurrent). Topic of discussion was Posthumus, Big Data and New Interfaces. After this discussion we had some good presentations by Ed Boyajian (EnterpriseDB) and after that Barry Devlin (9sight consulting ). Next was a very lively talk by DJ Patil (LinkedIn), and he showed very convincingly that the success of working with big data at LinkedIn is only possible with a good team of talented people. Scott Yara (EMC) came next, and also had a lively talk full of humor on how Your Data Rules The World. The closing keynote was from Carol McCall (Tenzing Health) with a serious problem brought with humor on how big data analytics can be used to improve the US healthcare, and turn it ‘from sickcare into healthcare’.
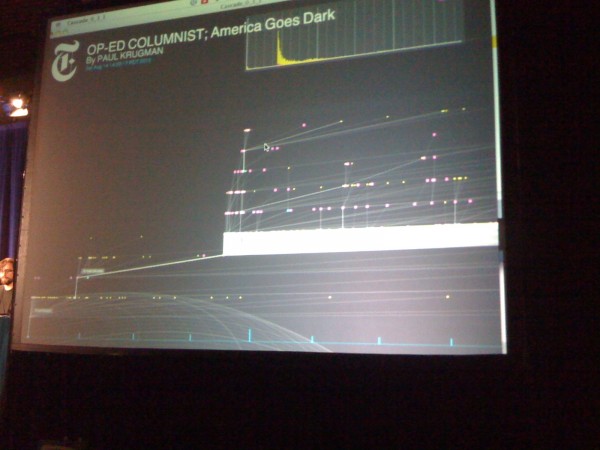
As my first session I chose a talk on Data Journalism, Applied Interfaces. Marshall Kirkpatrick (ReadWriteWeb) showed some really useful tools, like NeedleBase, that he uses for discovering stories on the Internet. He was followed up by Simon Rogers of The Guardian again, who more or less continued his keynote, showing very compelling examples of how The Guardian uses data to tell stories, and how they use for instance Google Fusion Tables to publish many of their data. The last speaker of this session was Jer Thorpe, and he absolutely blew me away with a beautiful interface he has created in Processing as an R&D project together with the New York Times. It’s called Cascade, and shows a visual representation of how Twitter messages are cascaded over various followers and links.

My next session was on ‘RealTime Analytics at Twitter’ where Kevin Weil mainly explained RainBird, a project they use for various counting applications so that realtime analytics can easily be applied. The project will be opensourced in the near future.
After the break I saw a session on AnySurface: Bringing Agent-based Simulation and Data Visualization to All Surfaces by Stephen Guerin (Santa Fe Complex). He showed how using a projector and a table of sand can be used to enhance a data visualization for simulation purposes. As an example he showed us how he projects agent-based models and emergent phenomena in complex system dynamics can help firefighters simulate bottlenecks in escape routes. It was also very cool to see that many of his simulations are built in Processing. Next up was a session by Creve Maples (Event Horizon) and I really like the first part of his talk, because he had a very good story on how we should keep the capacity of the human brain for processing information in mind when designing products and tools. It was really good to hear such a strong emphasis on this. The last part of his talk was mainly about some of the 3D visualizations he has done in the past that were very successful for his company, but didn’t struck me as much as the first half of his talk.
The session on Data as Art by J.J. Toothman (NASA Ames Research Center) was a good an fun talk with many examples of infographics and visualizations. I had already seen most of them myself, some were new. It was a great talk with lots of eye-candy. The final talk of the conference I saw was about Predicting the Future: Anticipating the World with Analytics. Three speakers gave their vision on how they do that: Christopher Ahlberg (Recorded Future ) showed how his companies uses time-related hints (like the mention of the word ‘tommorrow’) in existing content on the Internet can be used to more or less predict the future. Robert McGrew (Palantir Technologies) showed how analyzing many large datasets in combination with human analysis can be used to perform effective fraud and crime predication. Finally Rion Snow (Twitter) showed that research has proven that analyzing tweets can be used effectively for stock market prediction (3 days ahead!), flu and virus spread prediction, and UK election result prediction (more accurate than exit polls). The predictive power of analyzing the Twitter crowd was really stunning.
This concluded the O’Reilly Strata Conference. The conference was fantastic, the sessions were great, and most of all, meeting all these people was probably even the best of all!
===========
I’d like to thank Jan for sharing his thoughts on the conference, I really appreciate his time and effort in writing these at the end of each day, after what sound long and energetic sessions!
Congratulations also to O’Reilly who appear to have organised and executed a fantastic new event. I look forward to New York in September.
