




The World Cup is over!! And wow…
I know people have had mixed feelings about the tournament, but one thing no one can deny is that it has been full of memorable moments. From Cabo Verde coming out of nowhere and stealing everyone’s hearts, to England and France battling it out for bronze, and of course, the final itself. It’s been one incredible tournament.
But while the players have been putting their hearts on the line, another battle has been taking place in the background: the battle between football fans and technology.
I don’t know how many people I’ve heard say that the thing they dislike most about the modern game is VAR and all the technology now involved in football. I mean, in one match, there were even arguments about whether the ball had hit a drone before coming back down! Whether you love it or hate it, technology is now deeply woven into the game.
And where there are drones, AI and controversy… There must be data.
Data In The Wild
Welcome back to another edition of Data in the Wild, the series where we investigate how data is formed, collected and used to influence the world around us. Today, we’re going to explore three ways data and technology are shaping modern football: the ball, the game and the culture.
Let’s do it.
Data & Technology in Football Isn’t New
This may seem obvious to some, but it doesn’t hurt to be reminded. As much as it feels like technology in football is a recent phenomenon, it’s actually been evolving for decades.
For most of football’s history, the game relied almost entirely on human judgment. Referees made decisions based on what they saw, coaches relied on memory and handwritten notes, and fans debated controversial moments for years because there simply wasn’t a way to know for certain what had happened.
Technology slowly began changing that.
During the 1980s, video analysis gave coaches the ability to replay matches repeatedly, transforming how teams prepared, learned and developed tactics. Then, throughout the 1990s and early 2000s, sports science became increasingly important. Heart rate monitors, GPS trackers and performance data helped clubs understand how hard players were working, reduce injuries and tailor training to individual athletes.
But the biggest shift came during the last decade.
Rather than simply helping players perform better, technology began helping officials make decisions. Goal-line technology, introduced at the highest level in 2012, could instantly determine whether the whole ball had crossed the line. A few years later came Video Assistant Referees (VAR), giving officials access to multiple camera angles to review game-changing incidents.
As much as people claim technology is taking the thrill out of football, I have to admit that if a “Hand of God” moment happened in today’s game and nobody could prove what really happened, the corruption allegations would probably be on another level.
So, let’s get into the tech.
The Ball: The Smartest Thing on the Pitch
Let’s start with something I genuinely didn’t know until a few weeks ago.
Believe it or not, one of the smartest things on the pitch isn’t actually one of the twenty-two players or even the coaches standing on the sidelines.
It’s the football.
Inside the official match ball is something called an Inertial Measurement Unit (IMU), and it’s actually something you’ve encountered before.
In fact, if you’re reading this on your phone, you’re probably holding one right now.
Think about what your phone can do. It knows when you rotate it, which is why the screen flips between portrait and landscape. It knows when you’ve dropped it (hopefully not too many times), and it can even count your steps while you’re walking around.
The football works using a very similar idea.
Instead of measuring your movement, however, it spends the entire match measuring its own.
Inside the ball are tiny motion sensors that monitor changes in movement around 500 times every second. Every kick, every header, every deflection and every tiny touch changes the way the ball moves. Those changes are detected almost instantly, allowing the system to identify the exact moment the ball has been played.
At first, I didn’t think that sounded particularly impressive.
I mean… surely we can already see when someone kicks a football?
Well… yes and no.
Imagine trying to work out the exact moment someone kicks the ball using only television footage. Most broadcast cameras record around 50 images every second, which sounds like a lot until you compare it to the sensor inside the football. While the camera captures around 50 snapshots during a second of play, the ball is quietly collecting around 500 measurements over that same period.
That means the sensor can provide a much more precise timestamp for when the ball was actually touched. We’re talking about differences measured in milliseconds, but in football, a few milliseconds can be the difference between a player being onside or offside.
Of course, the football can only tell us when it was touched.
It can’t tell us who touched it.
For that, the stadium needs another pair of eyes entirely.
The Game: The Stadium Has Eyes
So, if the football can tell us when it was touched, how does the system know who touched it?
That’s where the stadium comes in.
Hidden high above the pitch is a network of dedicated tracking cameras whose only job is to watch the game. They’re not there to create the television broadcast or capture dramatic slow-motion replays. They’re there to measure movement.
Imagine watching a football match through sixteen pairs of eyes that never blink, never get distracted and can remember exactly where every player has been for the last ninety minutes.
That’s essentially what these cameras do.
They continuously track the players and the ball, collecting positional information around fifty times every second. Rather than simply recognising that “there’s a footballer over there”, the system tracks different parts of each player’s body using computer vision, creating a constantly updating digital representation of the match.
And this is what powers semi-automated offside.
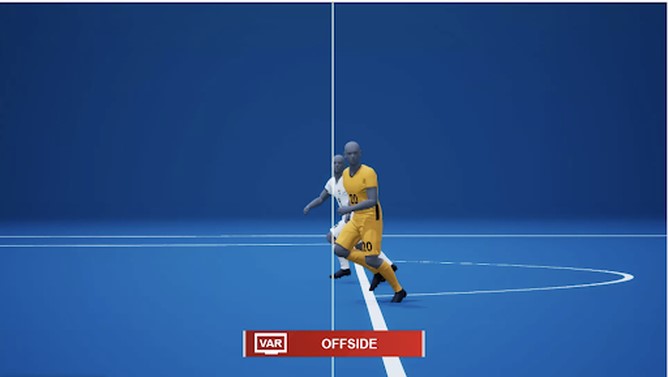
If you’ve ever watched a VAR offside check, you’ve probably seen those 3D animations with players frozen in place and coloured lines appearing across the pitch. For the longest time, I assumed the computer was simply drawing lines on top of the television footage.
It turns out it’s much cleverer than that.
To decide whether a player is offside, the system needs to answer two questions:
Where was everybody?
And…
Exactly when was the ball played?
The cameras answer the first question by tracking the positions of the players.
The sensor inside the ball answers the second by detecting the exact moment the pass was made.
Artificial intelligence then combines those two streams of information, creating an automated offside alert for the video officials. They review the recommendation before passing the final decision back to the referee on the pitch.
That’s why FIFA calls it semi-automated offside rather than fully automated. The technology speeds up the process, but a human is still responsible for making the final decision.
Whether you love VAR or absolutely cannot stand it, I have to admit… that’s a pretty incredible piece of engineering.
The Culture: Commentary and Stats Merchants
Of course, what we’ve talked about today is only a small part of the story.
Once I understood how the technology worked, I suddenly looked at football statistics very differently. It made me realise that all the numbers commentators casually throw around during a match aren’t just random facts they’re built on carefully collected measurements, sound methodologies and statistical analysis.
The statistics we see on television are really just the final product.
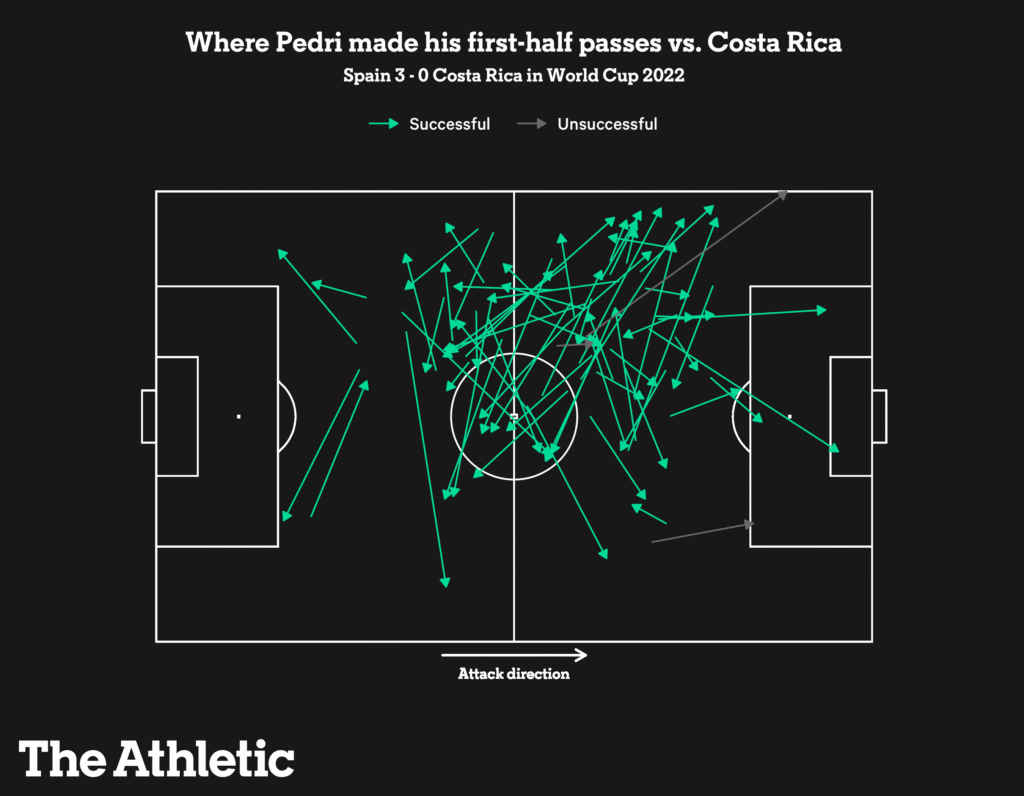
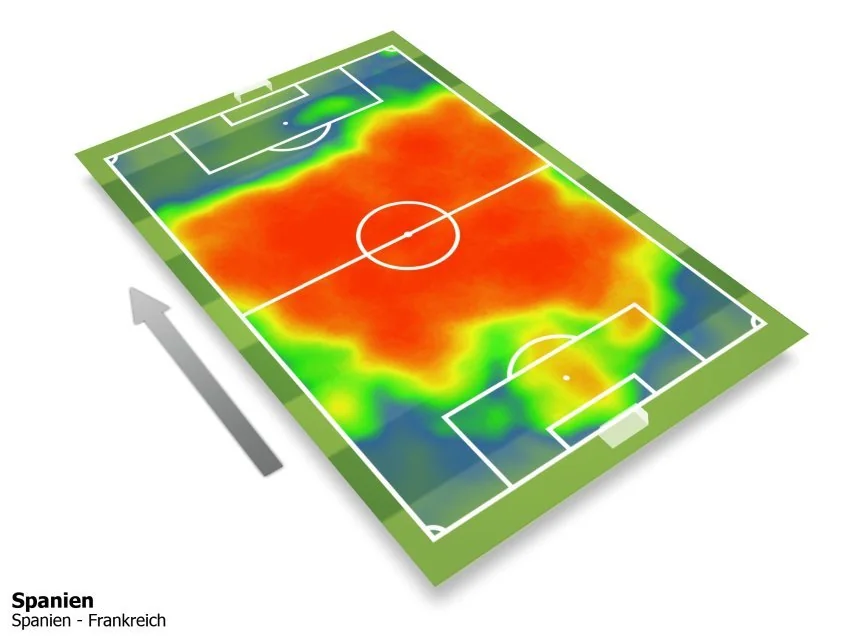
Passing maps are built from tracking where the ball has travelled around the pitch. Shot maps reveal where players tend to shoot from and which areas are most dangerous. Heat maps show where players spend most of their time during a match. Possession statistics, sprint speeds and distance covered all begin with thousands of tiny measurements collected throughout the game.
Behind the scenes, clubs take this even further. Coaches, analysts and sports scientists use performance data to monitor player workload, fatigue, recovery and overall well-being, helping players stay fit and perform at their best throughout a long season.
Perhaps what fascinated me most, though, wasn’t the technology itself.
It was how quickly football culture has embraced data.
During the World Cup final, my WhatsApp chats were full of screenshots of passing networks, expected goals charts, shot maps and player comparisons. It honestly threw me off.
People often say data is difficult to understand, but I think context makes all the difference. Put a chart in a report and some people switch off. Put that same chart next to a football match and suddenly millions of people are analysing it, debating it and sharing it with their friends.
Maybe data isn’t as inaccessible as we sometimes think.
Maybe people just need a story they already care about.
Looking at Football Differently
Similar to many other industries and sectors, we need to be honest: technology, AI and all of the innovations we’ve talked about today aren’t going to decrease. They’re only going to become even more integrated into our lives and, undoubtedly, into football.
Learning about the current uses of these technologies alone has blown my mind, so I can’t wait to see what new innovations emerge over the next few years.
One of my favourite things about writing this series is that it completely changes how I look at everyday things.
I can’t turn on my phone’s GPS without thinking about satellites.
I can’t walk through London without wondering how much location data is quietly being created around me.
And now…
I don’t think I’ll ever watch football in quite the same way again.
The next time I hear a commentator mention a player’s sprint speed or see an offside graphic appear on my screen, I’ll know there’s an invisible network of cameras, sensors and algorithms working behind the scenes to make that information possible.
So, if you’re interested in learning more about how technology is being used to shape the way we experience the world around us, I look forward to seeing you next time as we uncover more data…
…in the wild.

Data in the wild #14: Light, Lasers & LIDAR
Imagine mapping the world using light. That’s exactly what LiDAR does. It fires laser pulses that bounce off objects and return to a sensor, calculating distances with GCSE-level physics. Repeating this millions of times creates point clouds detailed 3D maps. From mapping cities to powering self-driving cars, LiDAR reveals the invisible.
Data in the Wild #13: Remote sensing
Our five senses are amazing… but limited.
Enter remote sensing: satellites, planes, and sensors that upgrade how we see the world. From zooming in on Google Earth to mapping the ocean floor sometimes the best datasets aren’t online — they’re captured from above, below, and beyond.

Data in the Wild #12: The Incan Origins of Information Design
Ancient Andean cultures used quipus knotted strings as a powerful form of data encoding. Long before spreadsheets, these tactile tools tracked census data, resources, and stories. Each knot carried meaning. Portable, durable, and deeply structured, quipus are a forgotten ancestor of modern data viz reminding us that information has always needed form.