
Data in the wild #14: Light, Lasers & LIDAR
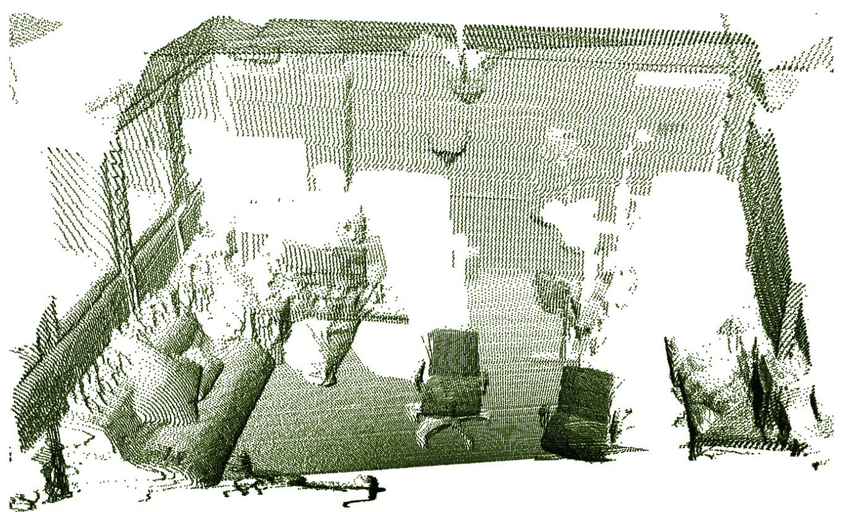
Imagine mapping the world using light. That’s exactly what LiDAR does. It fires laser pulses that bounce off objects and return to a sensor, calculating distances with GCSE-level physics. Repeating this millions of times creates point clouds detailed 3D maps. From mapping cities to powering self-driving cars, LiDAR reveals the invisible.
Data in the Wild #13: Remote sensing
Our five senses are amazing… but limited.
Enter remote sensing: satellites, planes, and sensors that upgrade how we see the world. From zooming in on Google Earth to mapping the ocean floor sometimes the best datasets aren’t online — they’re captured from above, below, and beyond.
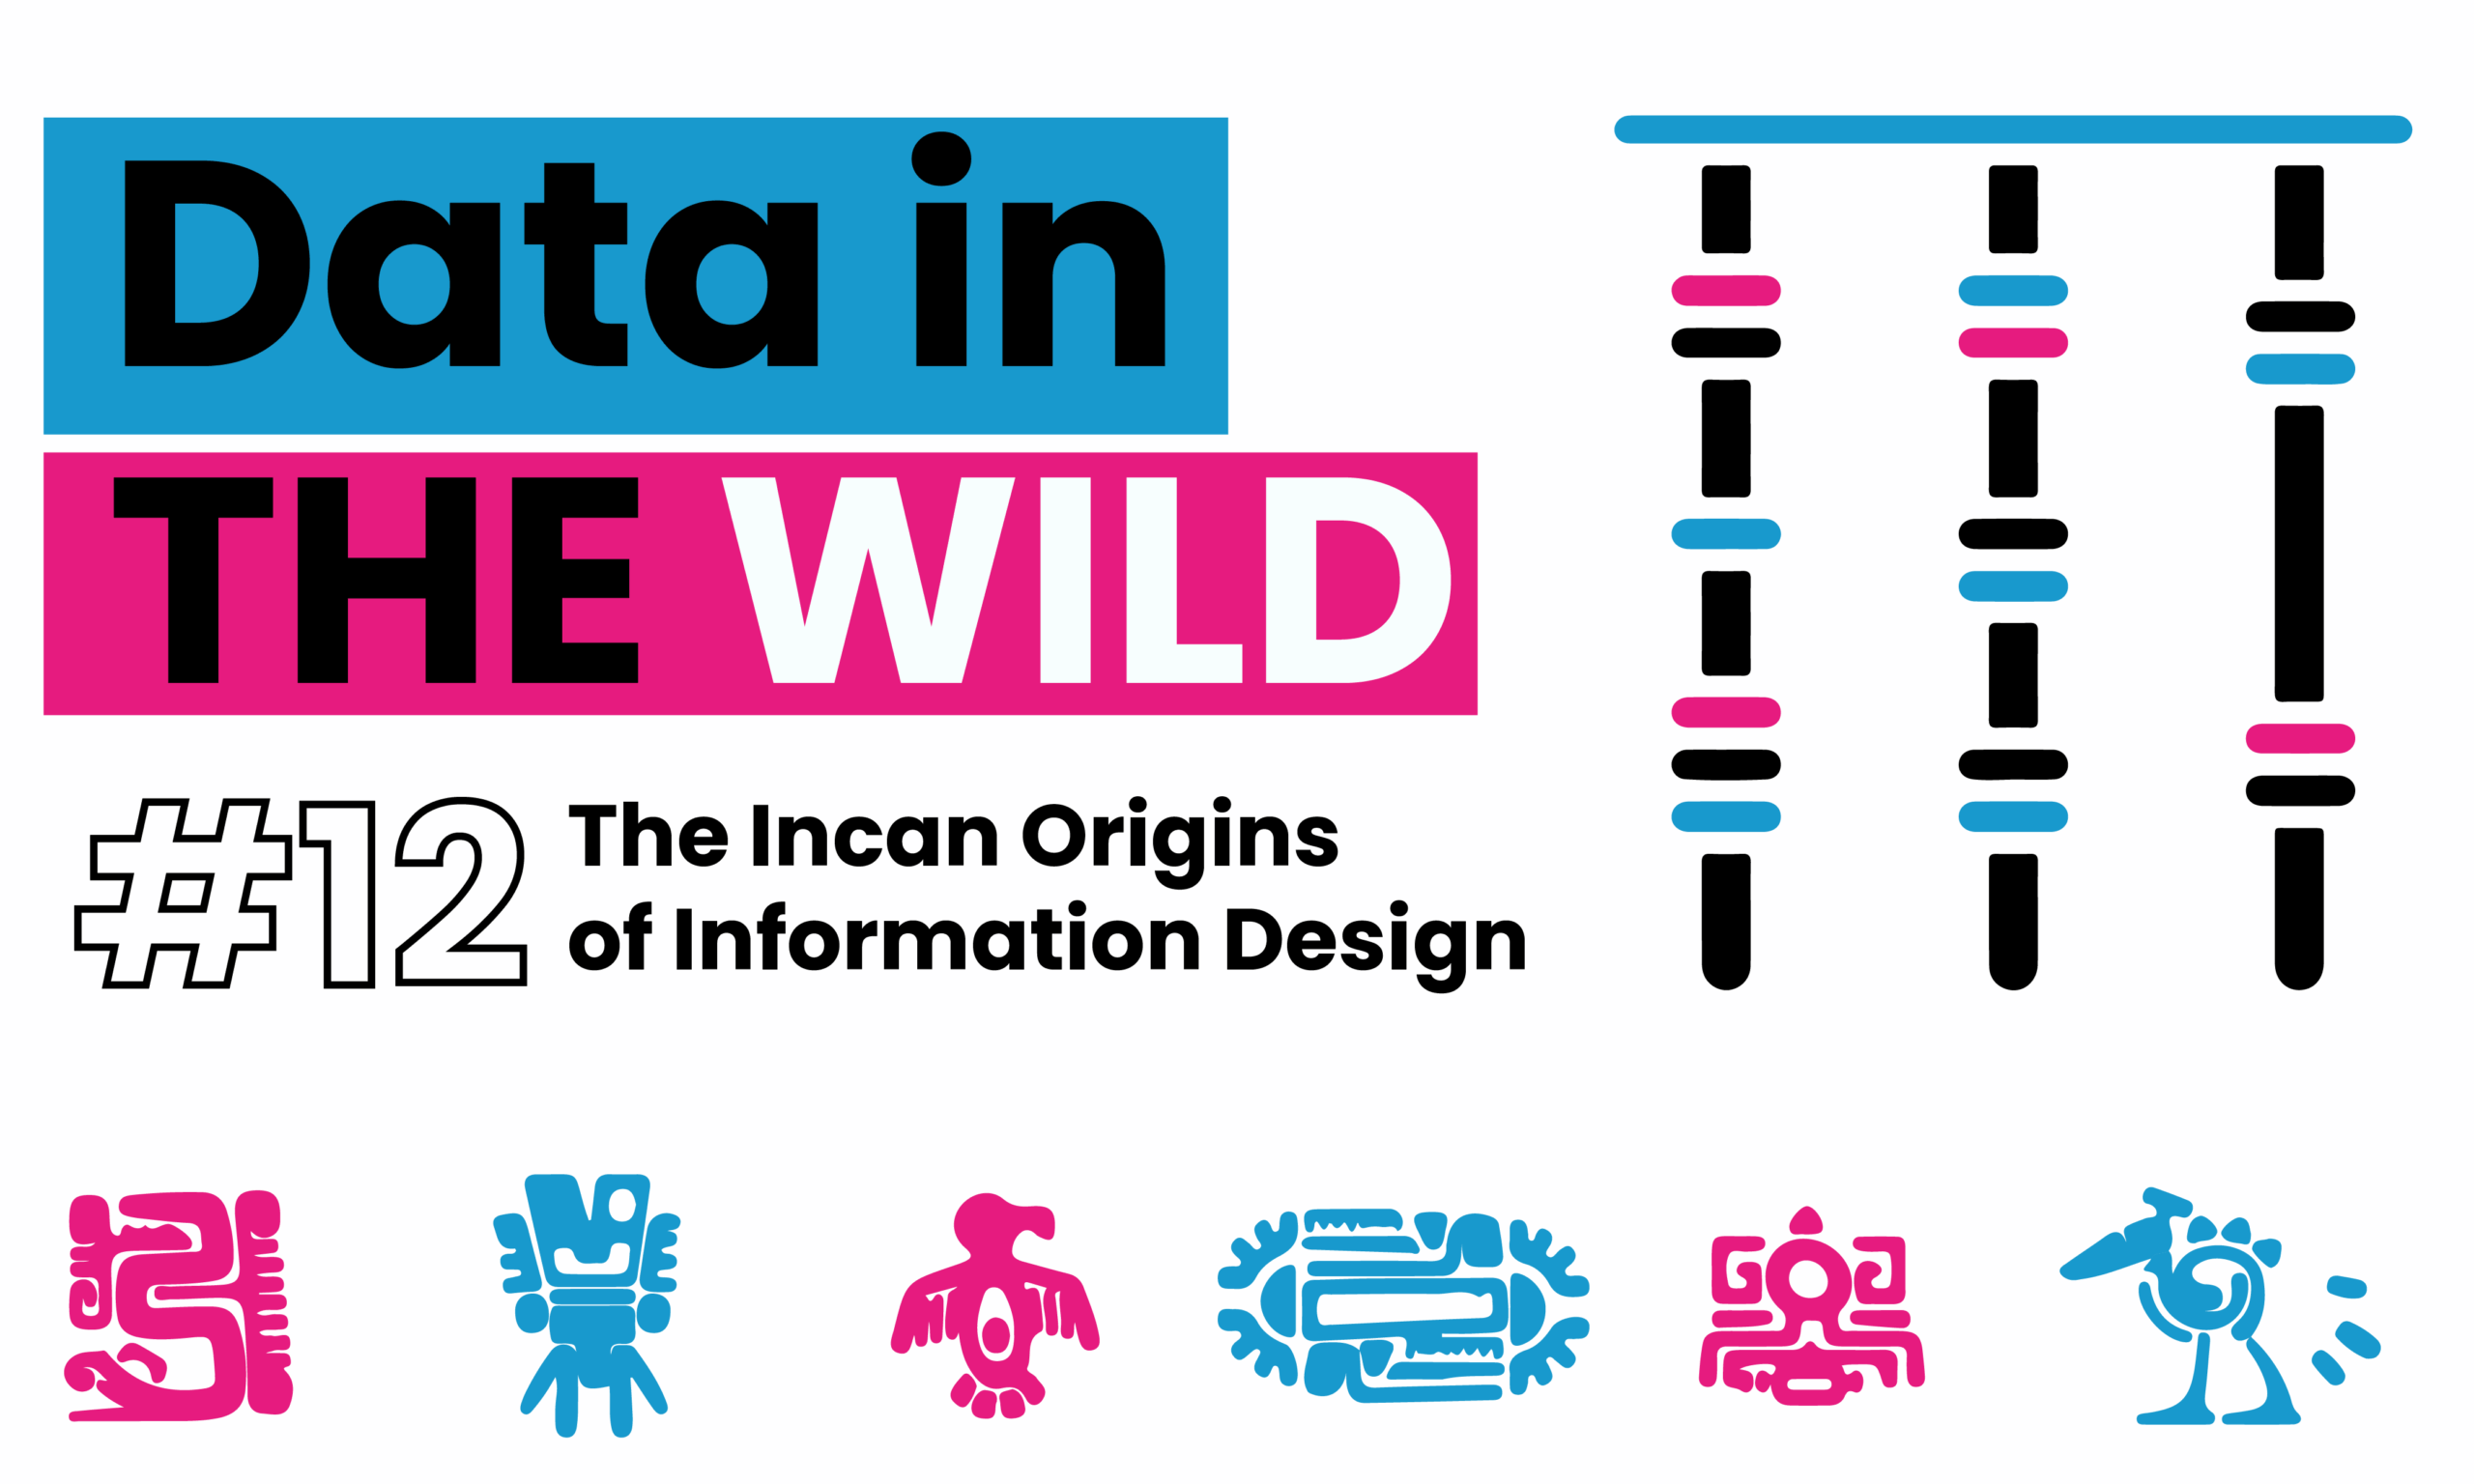
Data in the Wild #12: The Incan Origins of Information Design
Ancient Andean cultures used quipus knotted strings as a powerful form of data encoding. Long before spreadsheets, these tactile tools tracked census data, resources, and stories. Each knot carried meaning. Portable, durable, and deeply structured, quipus are a forgotten ancestor of modern data viz reminding us that information has always needed form.