The State of Our Senses
Humans have five senses: taste, touch, sight, hearing, and smell. They’re our built-in data collectors. They help us make sense of the world: you can see danger before it arrives, hear a warning shout, feel that something’s too hot to touch, or taste a muffin and know instantly it’s worth eating (within reason).
But here’s the catch: our senses only go so far. We might see a sandstorm rolling toward us, but by the time our eyes register it, it’s already too late to do much. Same with hearing thunder you know the storm is close, but you can’t measure how far or how fast. That’s where remote sensing steps in.
Welcome to Data in the Wild
Welcome back to Data in the Wild, the series where we explore everyday examples of data viz in action. It’s always a pleasure to speak to people who would never forgive a pie chart crime but will still make a 3D bar chart “just to see how it looks.” Today, we’re zooming in (and out) on remote sensing.
So what is it? According to NOAA:
Remote sensing is the science of obtaining information about objects or areas from a distance, typically from aircraft or satellites.
National Oceanic and Atmospheric Administration
Basically, it’s our five senses… but stretched out with tech. Think of it as super-vision, super-hearing, super-smelling, without the radioactive spider bite.
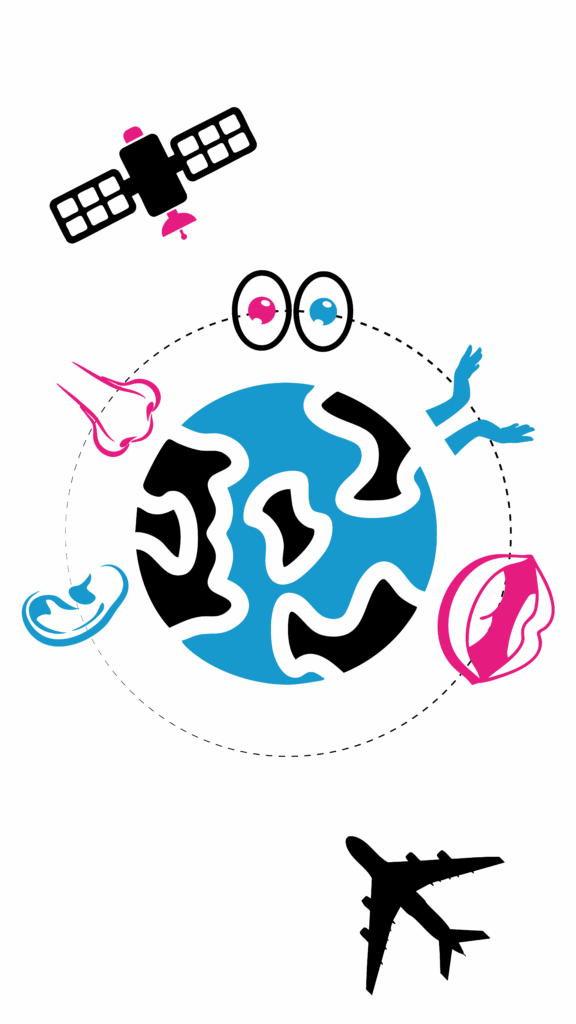
Here are a few flavours of it:
- Space-based sensing: Satellites circling the Earth, snapping photos that end up in Google Earth. Great for tracking land use, deforestation, or even the sprawl of cities over time. The downside? They’re a bit far away, so the resolution isn’t always sharp, and real-time updates can be tricky.
- Airborne sensing: Planes can fly lower and carry powerful sensors. Want a high-quality map of a flood zone today? Strap a camera or scanner to a plane and go. Of course, this does assume you happen to own an aircraft.
- Underwater sensing: Submarines use sonar to “see” in the dark depths. The same tech maps the ocean floor, revealing underwater mountain ranges, canyons, and vast unexplored landscapes. Yes, Finding Dory was onto something.
- LiDAR: My personal favourite because… lasers. LiDAR (Light Detection and Ranging) shoots pulses of light and measures how long they take to bounce back, creating precise 3D maps. Cities use it for mapping, archaeologists for finding lost ruins, and me? I just think lasers are cool. Honestly, the only reason I stuck with physics at school was the dream of building one.
Uncommom Datasets
Now, why does remote sensing matter in a series about data viz? Because it’s not just about how we present data, it’s also about how we find it. If you only ever look at datasets you can download from the web, you’ll limit your perspective. Remote sensing reminds us that data is everywhere in the skies, under the sea, and bouncing off forests and cities. With the right tools, we can capture it and tell stories our senses alone could never reveal.
So yes, scrape the web, chase down Wikipedia tables, and wrestle with APIs. But don’t forget: with a sensor, a camera, or a laser, you can see the world in entirely new ways.
See you next time when we uncover more data… in the wild.
Data in the wild #15: The Data Behind Fireworks
Fireworks don’t just light up the sky they’re shaped by data. From wind modelling to sound limits, invisible thresholds decide what counts as “safe fun.” This Data in the Wild piece explores how decibels, maths, and regulation quietly shape one of our most beloved celebrations.
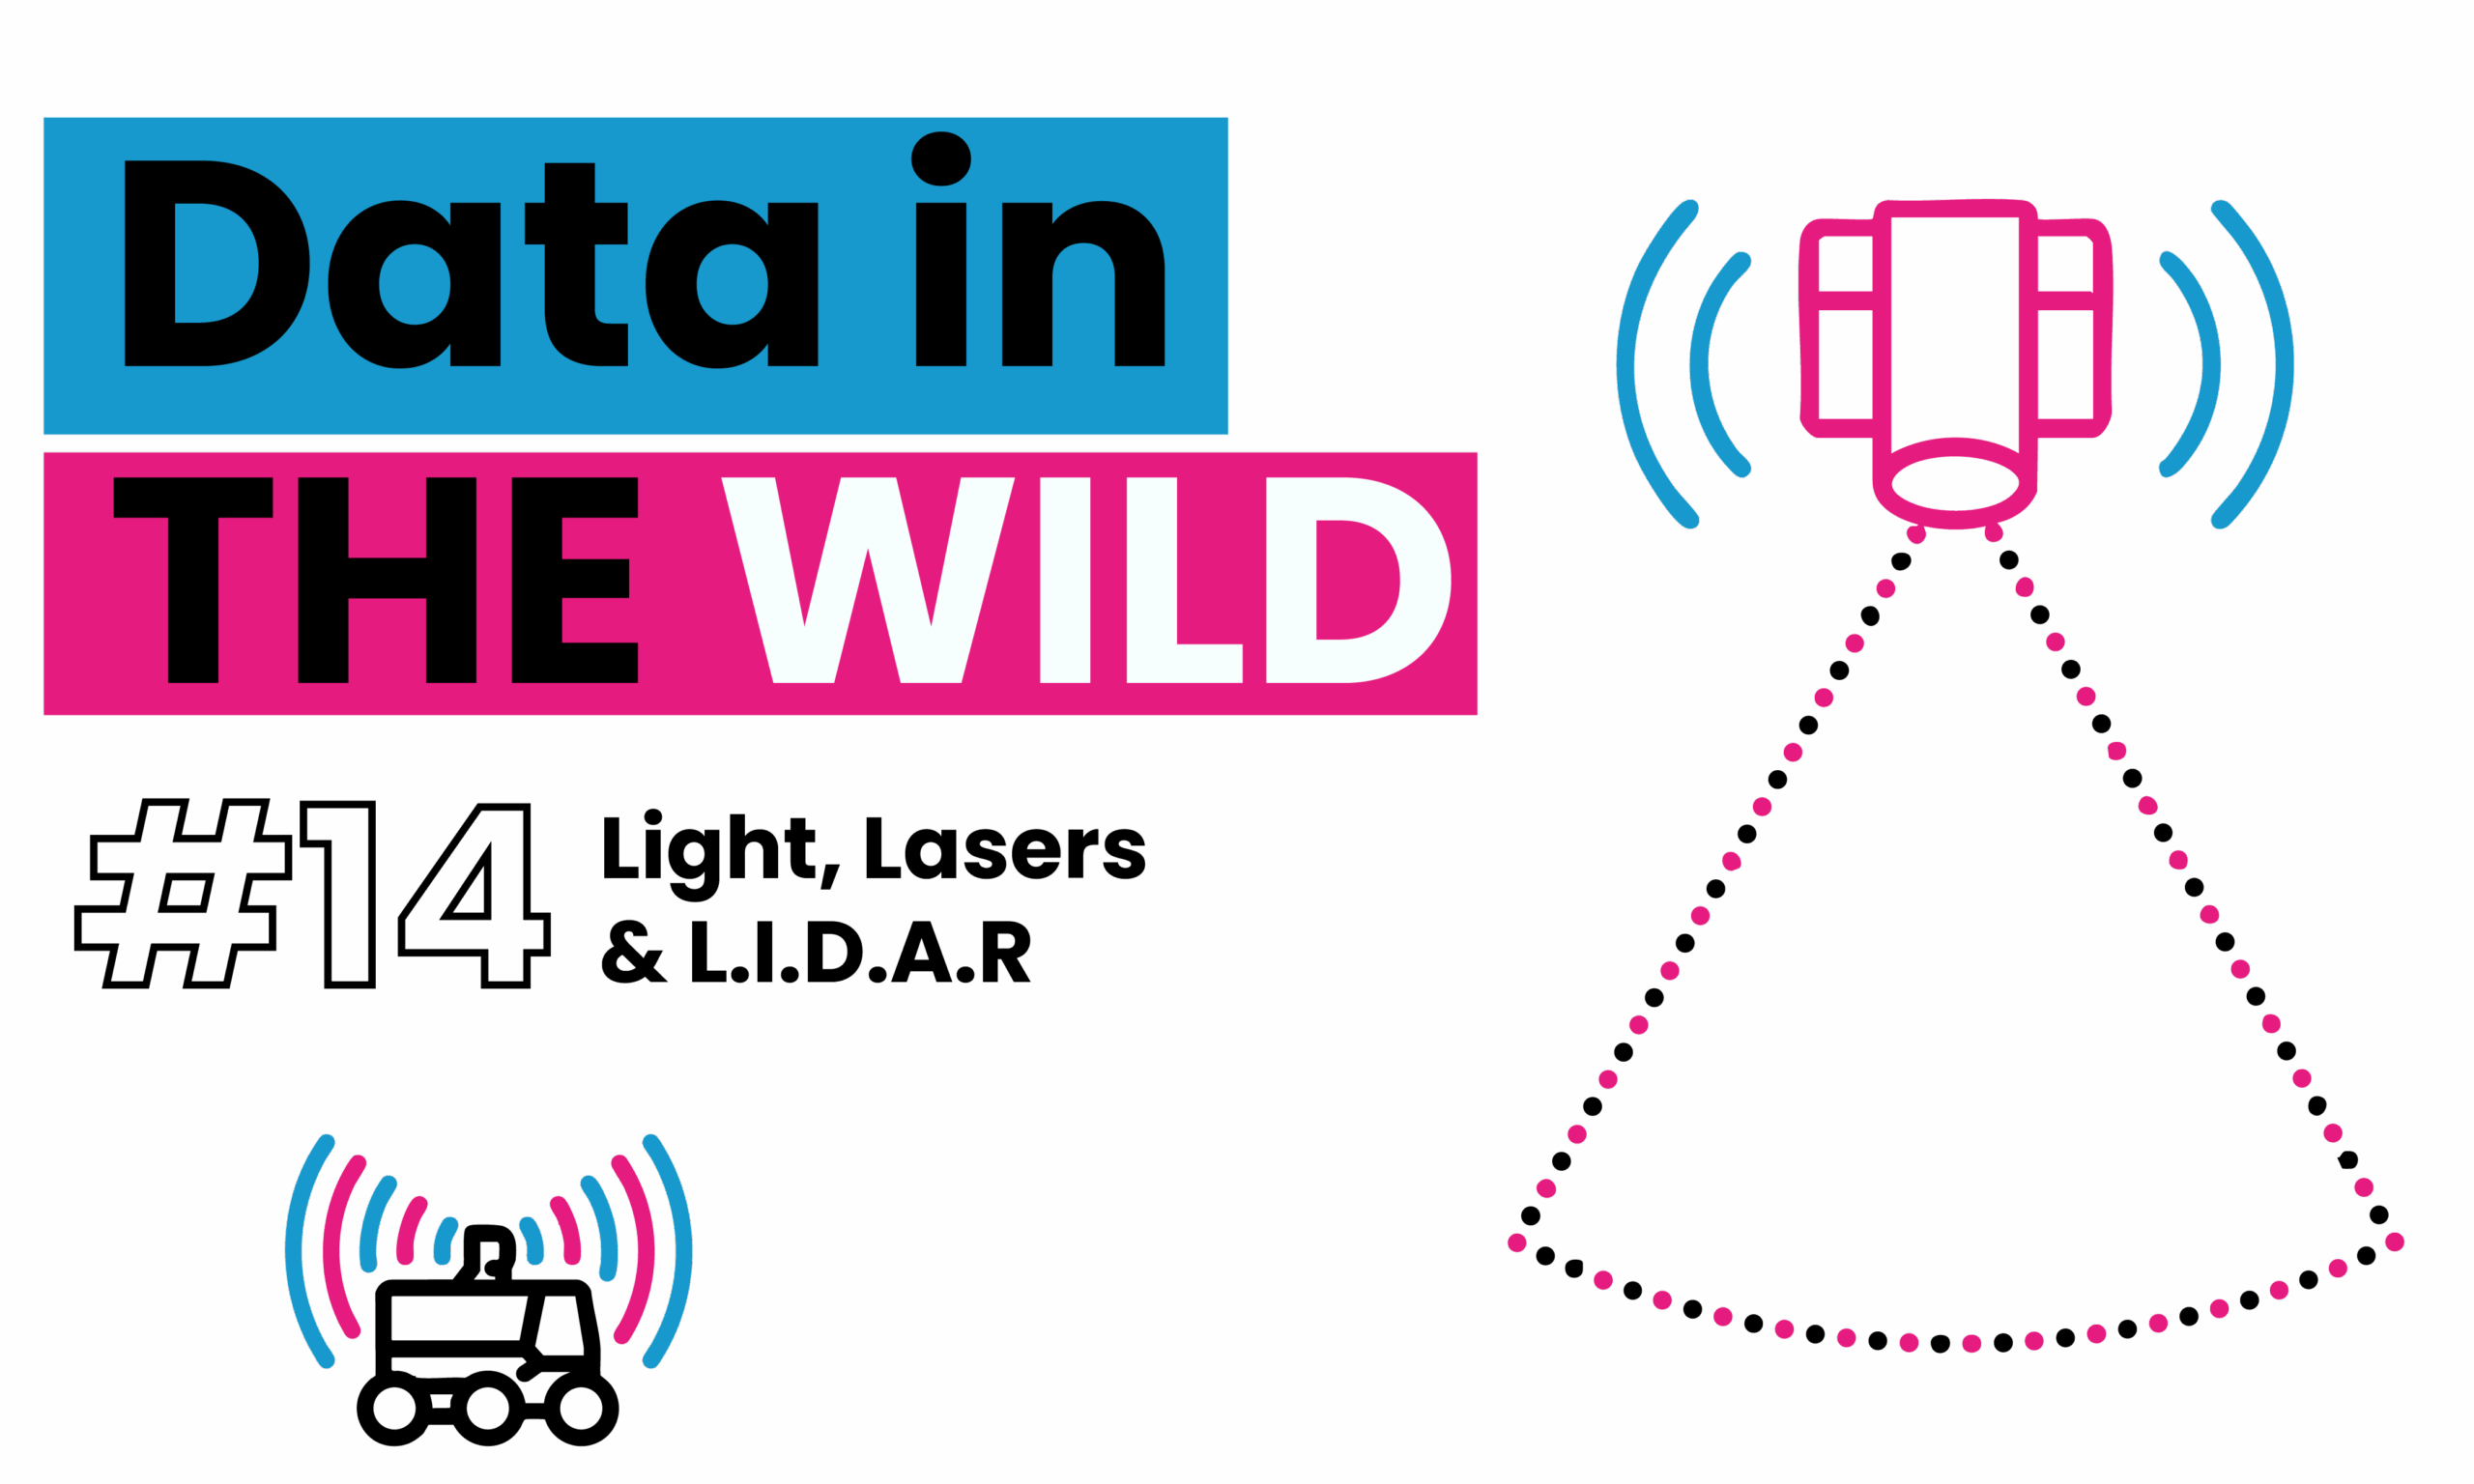
Data in the wild #14: Light, Lasers & LIDAR
Imagine mapping the world using light. That’s exactly what LiDAR does. It fires laser pulses that bounce off objects and return to a sensor, calculating distances with GCSE-level physics. Repeating this millions of times creates point clouds detailed 3D maps. From mapping cities to powering self-driving cars, LiDAR reveals the invisible.
Data in the Wild #13: Remote sensing
Our five senses are amazing… but limited.
Enter remote sensing: satellites, planes, and sensors that upgrade how we see the world. From zooming in on Google Earth to mapping the ocean floor sometimes the best datasets aren’t online — they’re captured from above, below, and beyond.

