Perception vs Reality
As it turns out, it’s actually much safer to live in Croydon than in central London. You’re less likely to have your bicycle stolen in Greenwich than in Southwark. And if you’re a proud car owner, the best advice I could give you is to stay far away from Kensington & Chelsea.
To the uninitiated, these may sound like random bits of pub trivia. But to a Londoner, this feels like a direct challenge to their social instincts. Cue the indignant response: “Dear sir, what is the source of your rambunctious misgivings?” Well, as it turns out, the answer is: the police!
Data in the Wild
Welcome back to Data in the Wild, the series where we uncover how data quietly shapes the world around us.
Thanks for being the kind of reader who knows that uncertainty cuts both ways. This one’s dedicated to all Londoners and today, we’re talking crime data.

Crime data, but with context
In 2017, the Mayor of London introduced the Police and Crime Plan, an “innovative approach to measuring what success looks like for London.”
Instead of holding all boroughs to a single, city-wide target, this plan proposed something more localised and realistic: each borough would be measured against its own local benchmarks and priorities. Crime categories would be broken down and tracked in greater detail, allowing for a more nuanced, community-specific view of safety.
This aims to promote local solutions to local problems in which boroughs prioritise and problem-solve between 2–4 volume crime priorities and Anti-Social Behaviour (ASB).
Office of Policing and Crime, Mayor of London
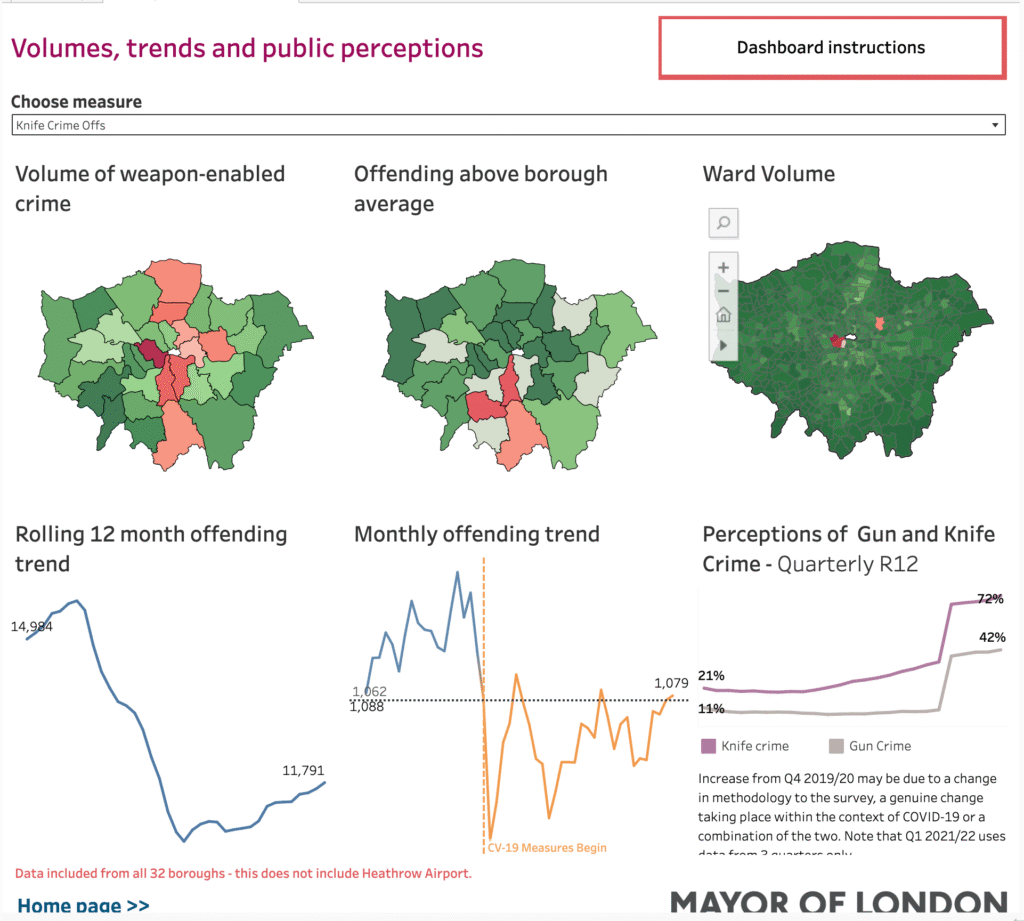
Enter the Crime Dashboard, powered by Tableau (naturally). It focuses on roughly 60% of all recorded crime, tracking monthly changes and rolling 12-month averages. It’s also open-source, meaning anyone can explore it.
What’s in the data and what’s missing?
Of course, there are limitations. 60% isn’t the whole picture, and the dashboard only updates monthly (on the 4th), which introduces a lag. Like any evolving dataset, changes in definitions or reclassifications can cause inconsistencies over time.
But even with its imperfections, this is a great example of data being used in the wild:
- It reframes how we view our neighbourhoods
- It challenges long-held assumptions.
- And crucially, it invites a more grounded, evidence-based conversation about safety.
When data meets emotion
Here’s where things get trickier: what happens when data collides with emotion?
It’s one thing to tell a business owner that they’re statistically twice as likely to be robbed in Newcastle than in Hackney. But it’s another to convince them that they feel safer.
Fear doesn’t always care about facts and that’s where the challenge lies.
Still, data like this gives us something we’ve always needed: a clearer lens. And perhaps that’s the first step in building not just safer cities, but better-informed citizens.
See you next time for more Data in the Wild.

Data in the Wild #11: Feeling Safe vs Being Safe
This edition of Data in the Wild explores London’s crime dashboard and how data challenges our assumptions about safety. From Croydon to Kensington, it reveals surprising truths and questions how data intersects with emotion. Can facts change feelings? A look at the power and limitations of data in public life.

Data in the wild #15: The Data Behind Fireworks
Fireworks don’t just light up the sky they’re shaped by data. From wind modelling to sound limits, invisible thresholds decide what counts as “safe fun.” This Data in the Wild piece explores how decibels, maths, and regulation quietly shape one of our most beloved celebrations.

Data in the Wild #9: Smart Meters, dumber homes?
Smart meters promised to revolutionise home energy use through real-time data. But over a decade since rollout began, the results have been mixed. In this latest Data in the Wild, we explore what smart meters reveal about the power and limits of data visualisation when infrastructure, design, and trust don’t align.

