

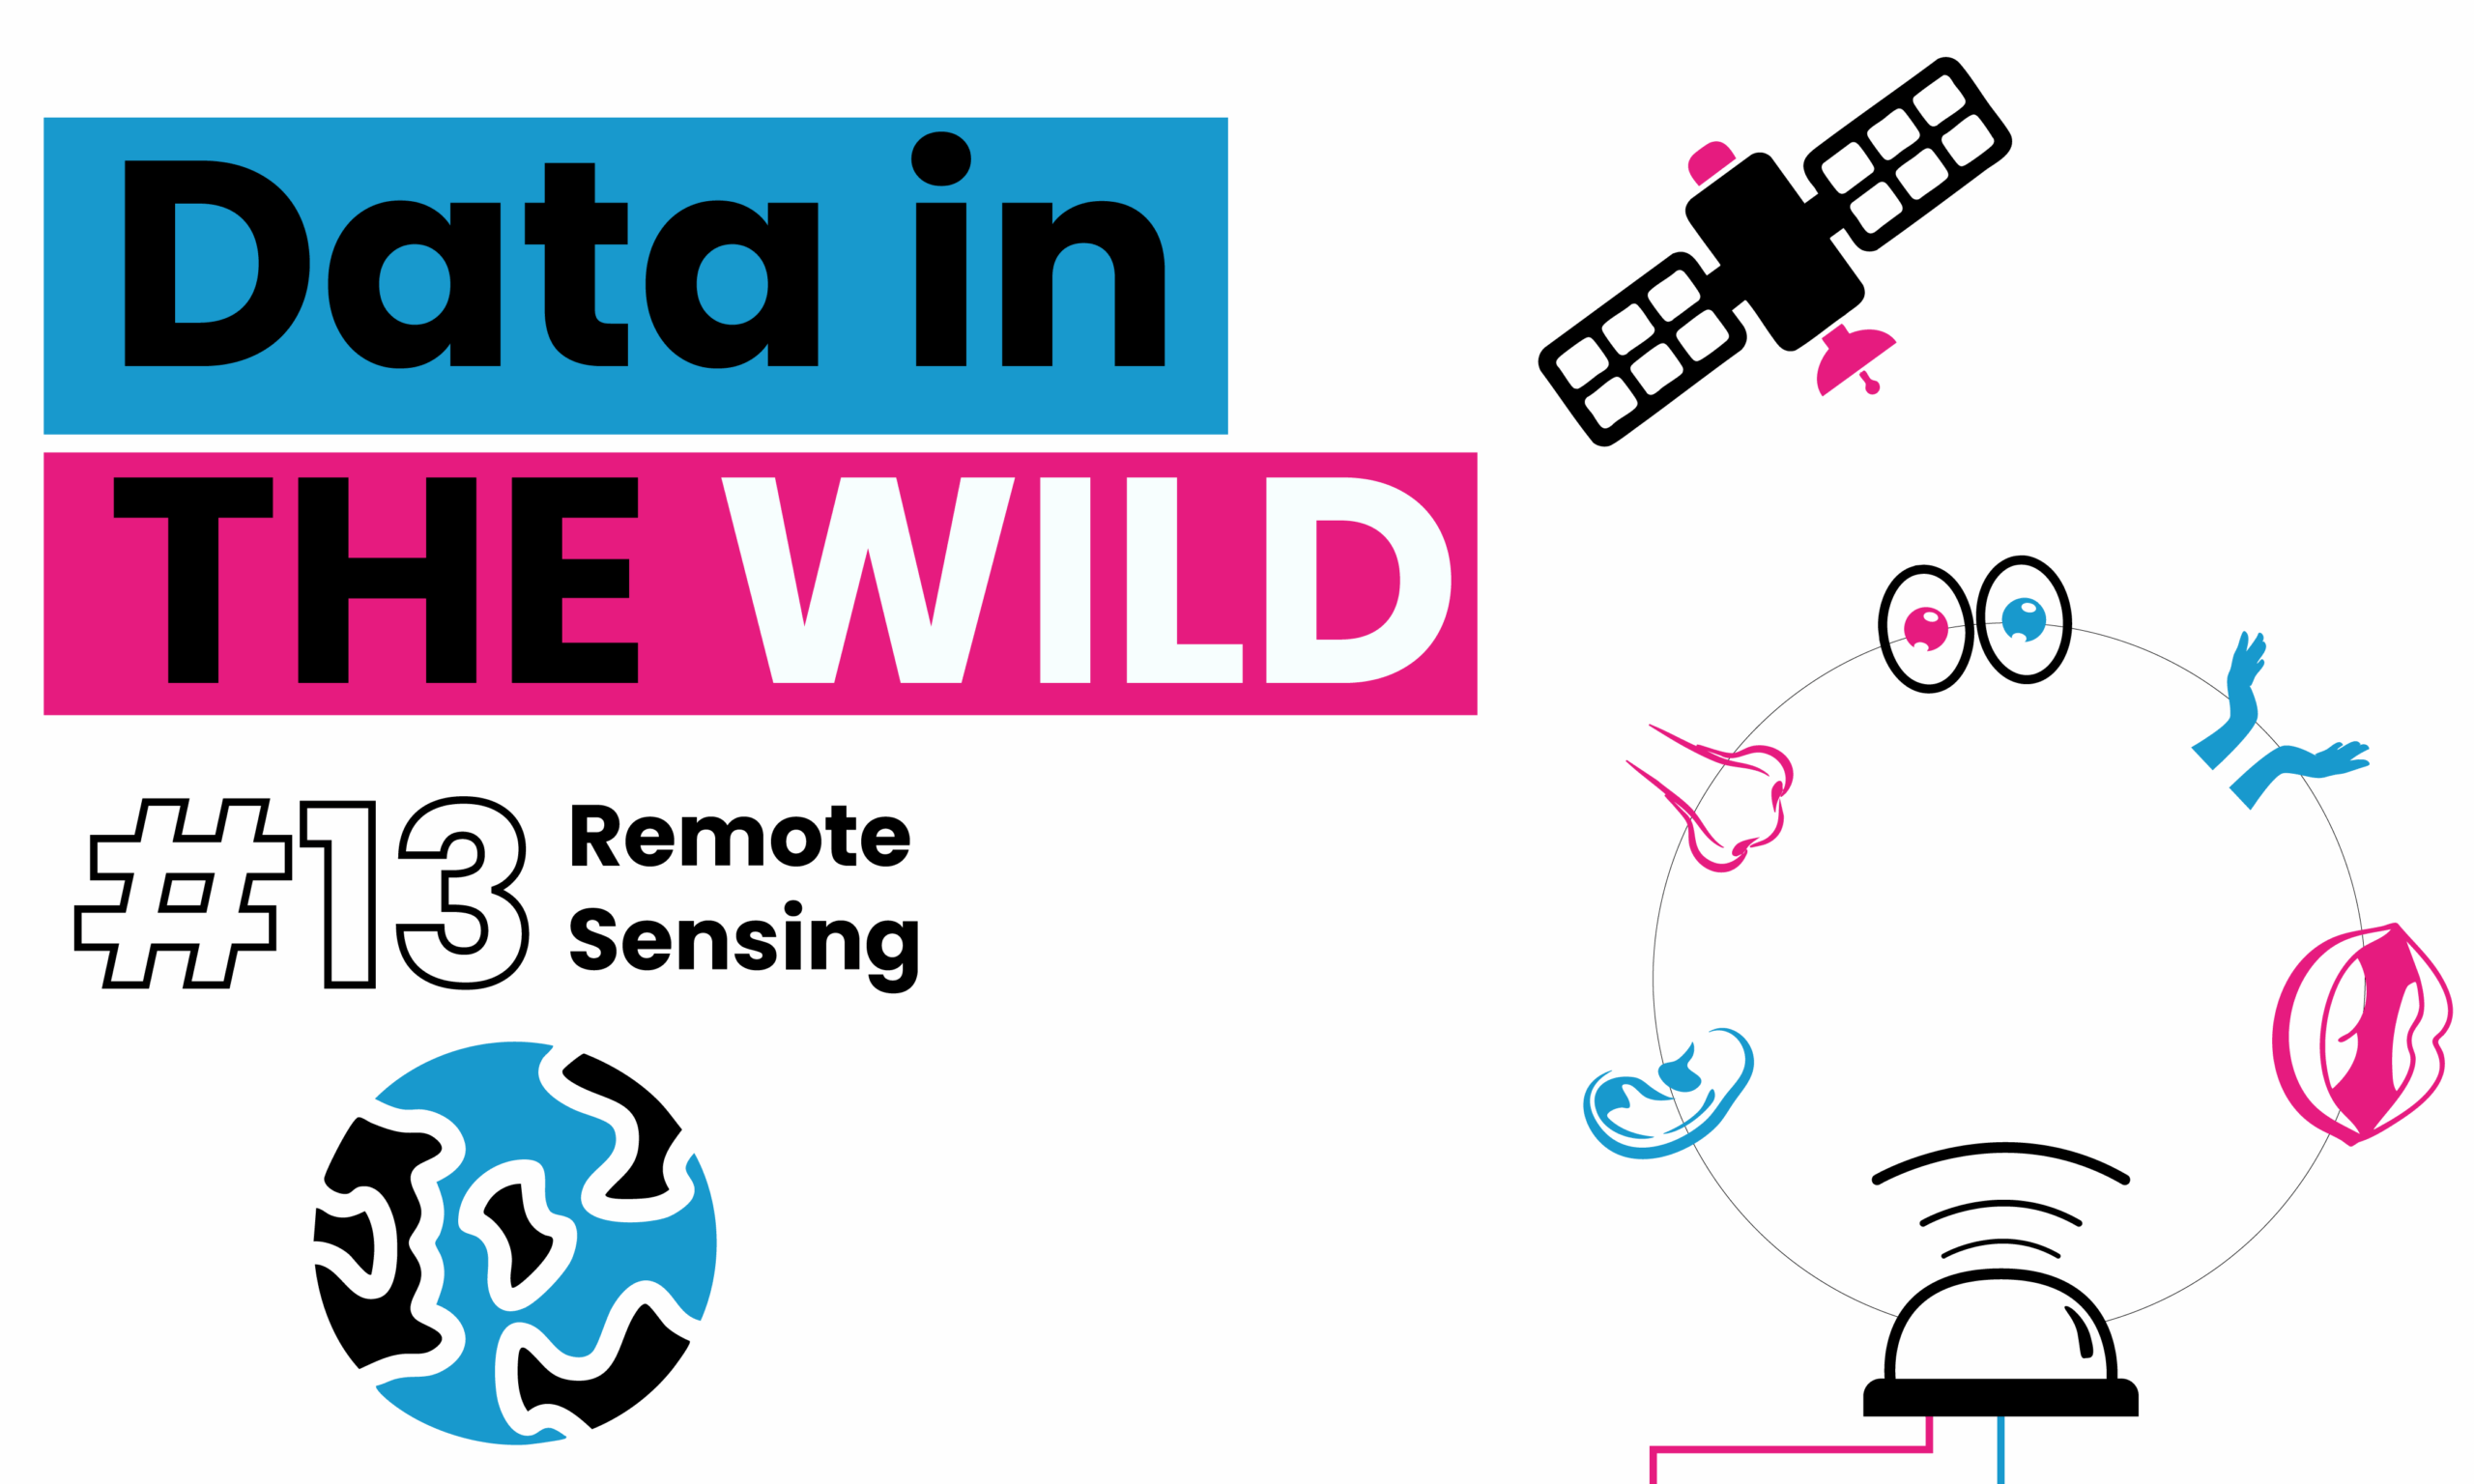
Data in the Wild #13: Remote sensing
Our five senses are amazing… but limited.
Enter remote sensing: satellites, planes, and sensors that upgrade how we see the world. From zooming in on Google Earth to mapping the ocean floor sometimes the best datasets aren’t online — they’re captured from above, below, and beyond.
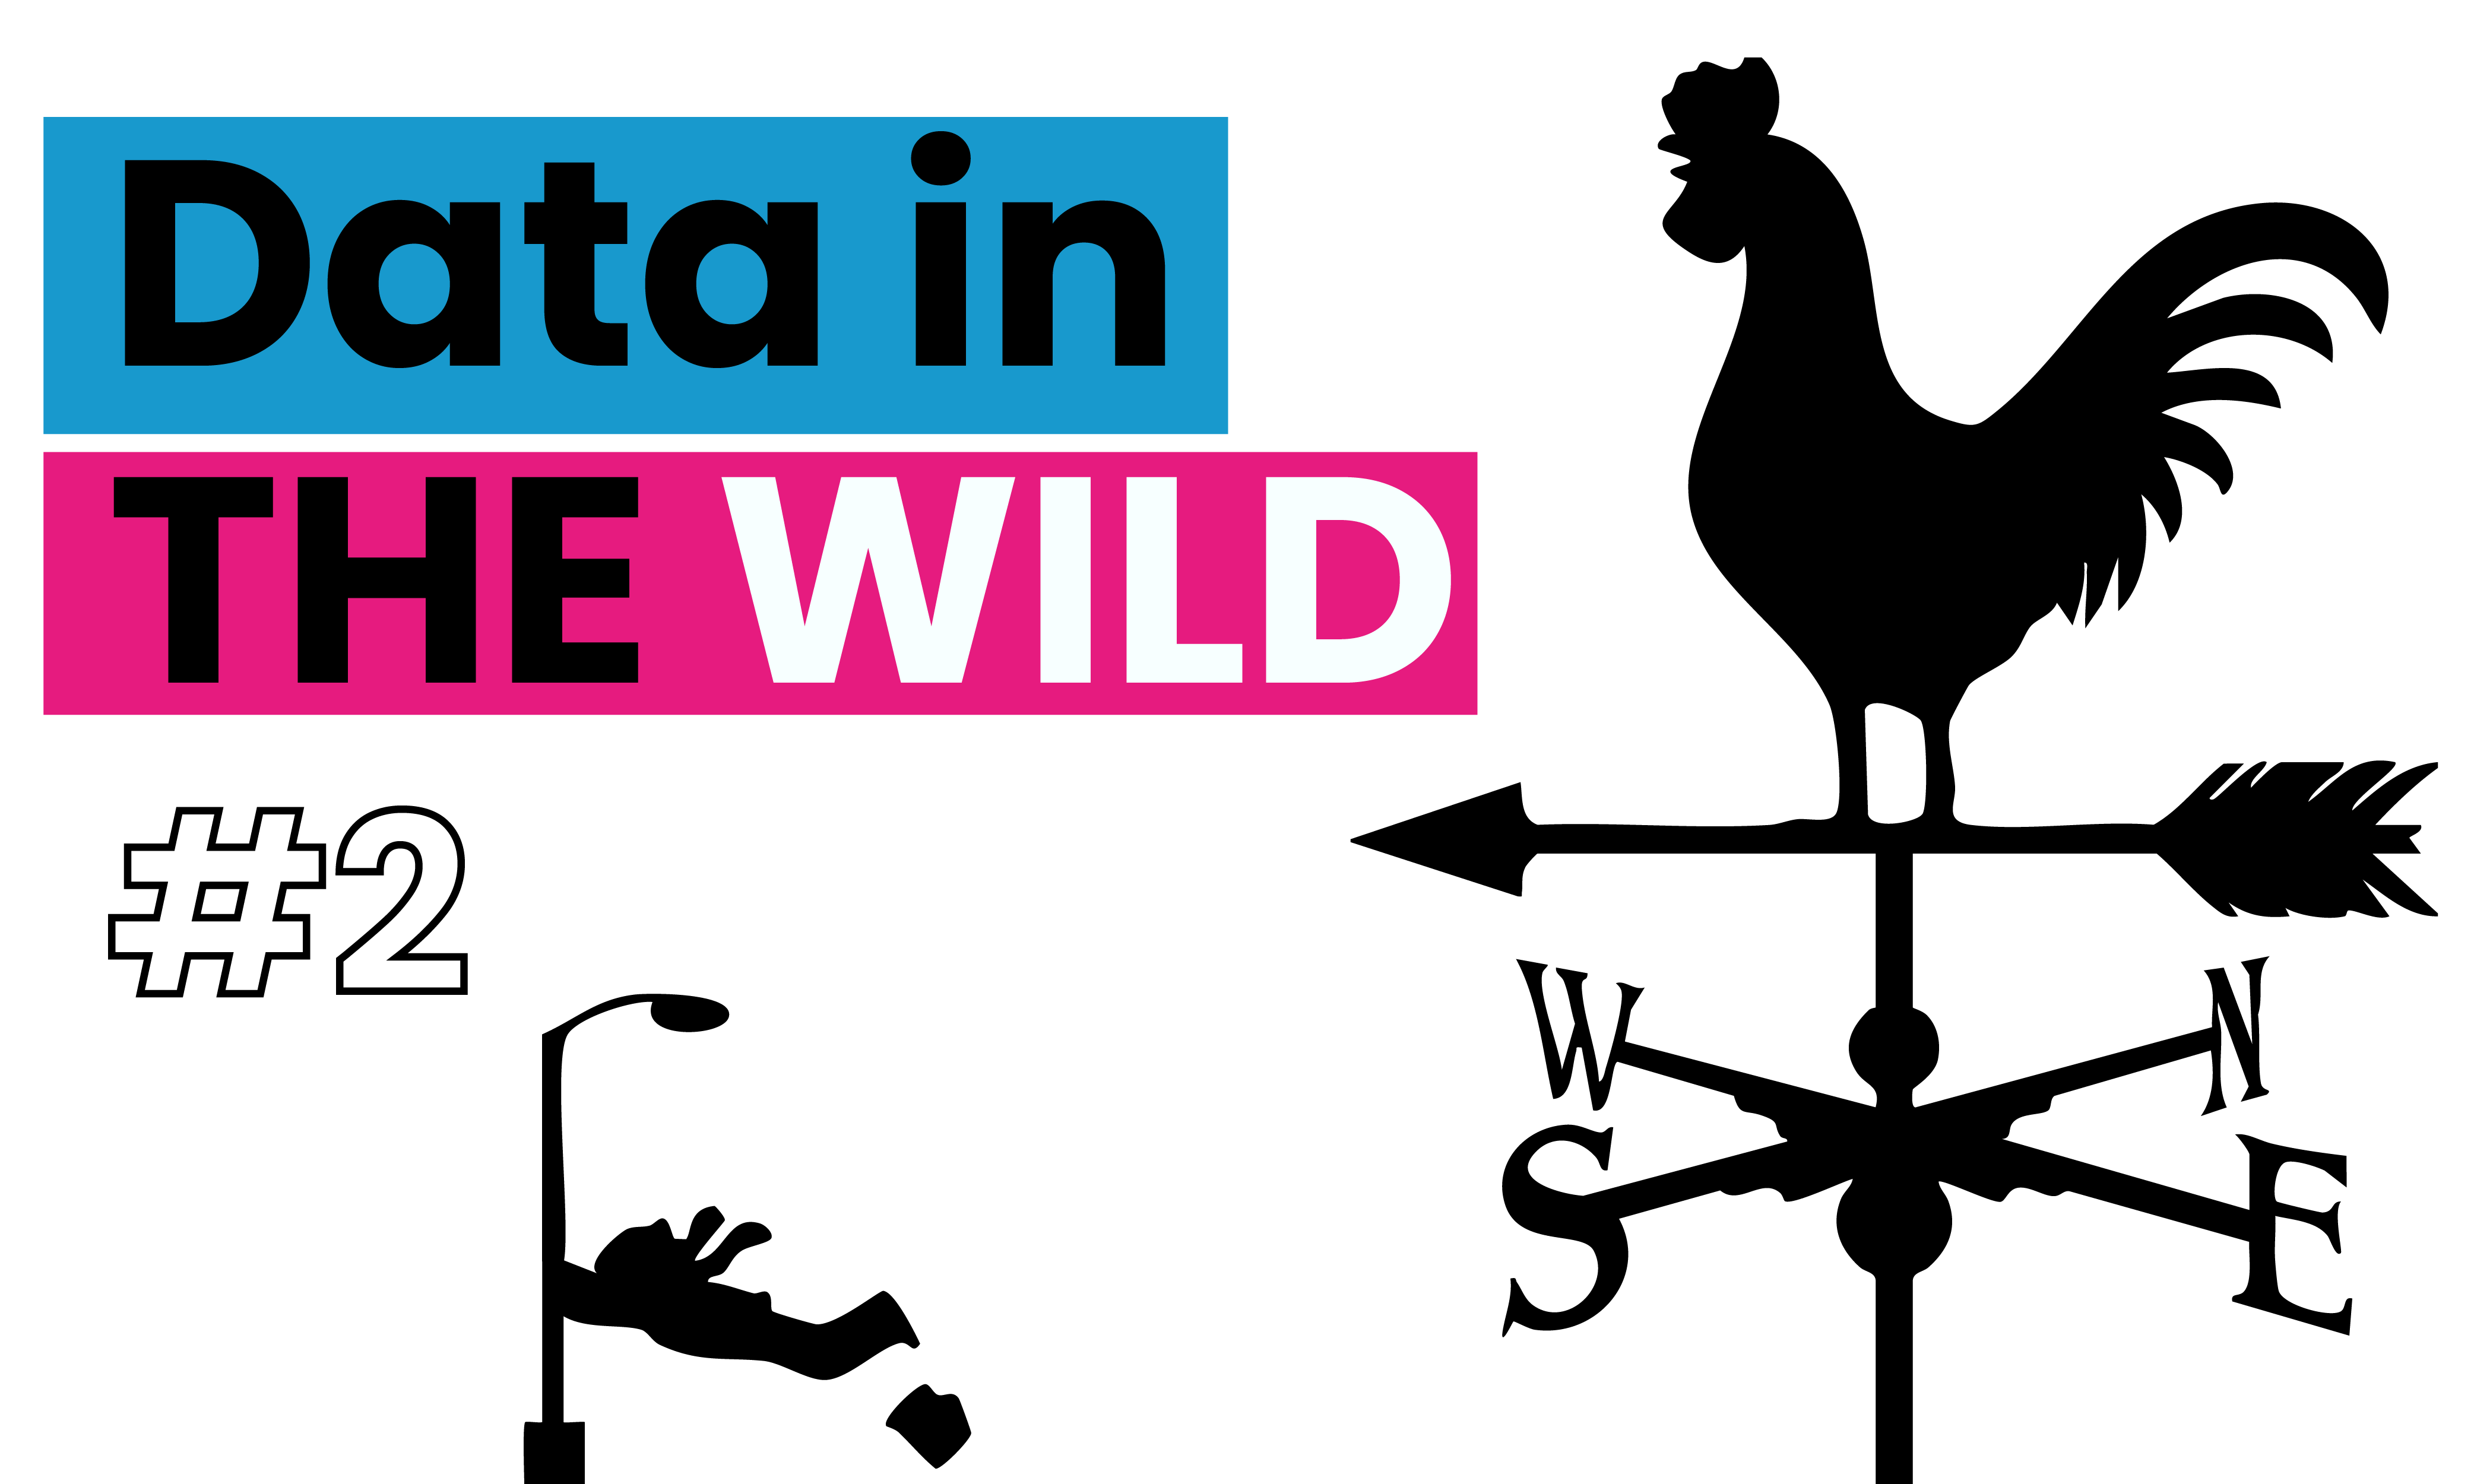
Data in the Wild #2
We’ve been visualising wind data for over 2000 years, have you ever wondered how such data viz can be used for you? Read this next part of data in the wild
Data in the Wild #3
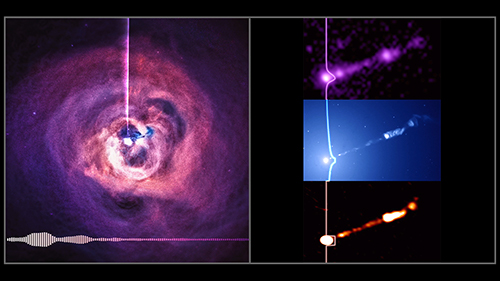
For the past few days, I’ve been out at sea, on a bit of a data investigation, which I hope to share with you all soon! This journey has taken me from Bergen to the Arctic Circle and back, and along the way, I’ve noticed something intriguing.