

Data in the Wild #10: When Data Speaks, The World of Sonification
Data sonification turns raw numbers into sound, transforming patterns into melodies we can hear and feel. From hospital monitors to black hole recordings, it’s an intuitive, emotional way to engage with information. In a world full of dashboards, sometimes the most powerful data is the kind we can listen to.
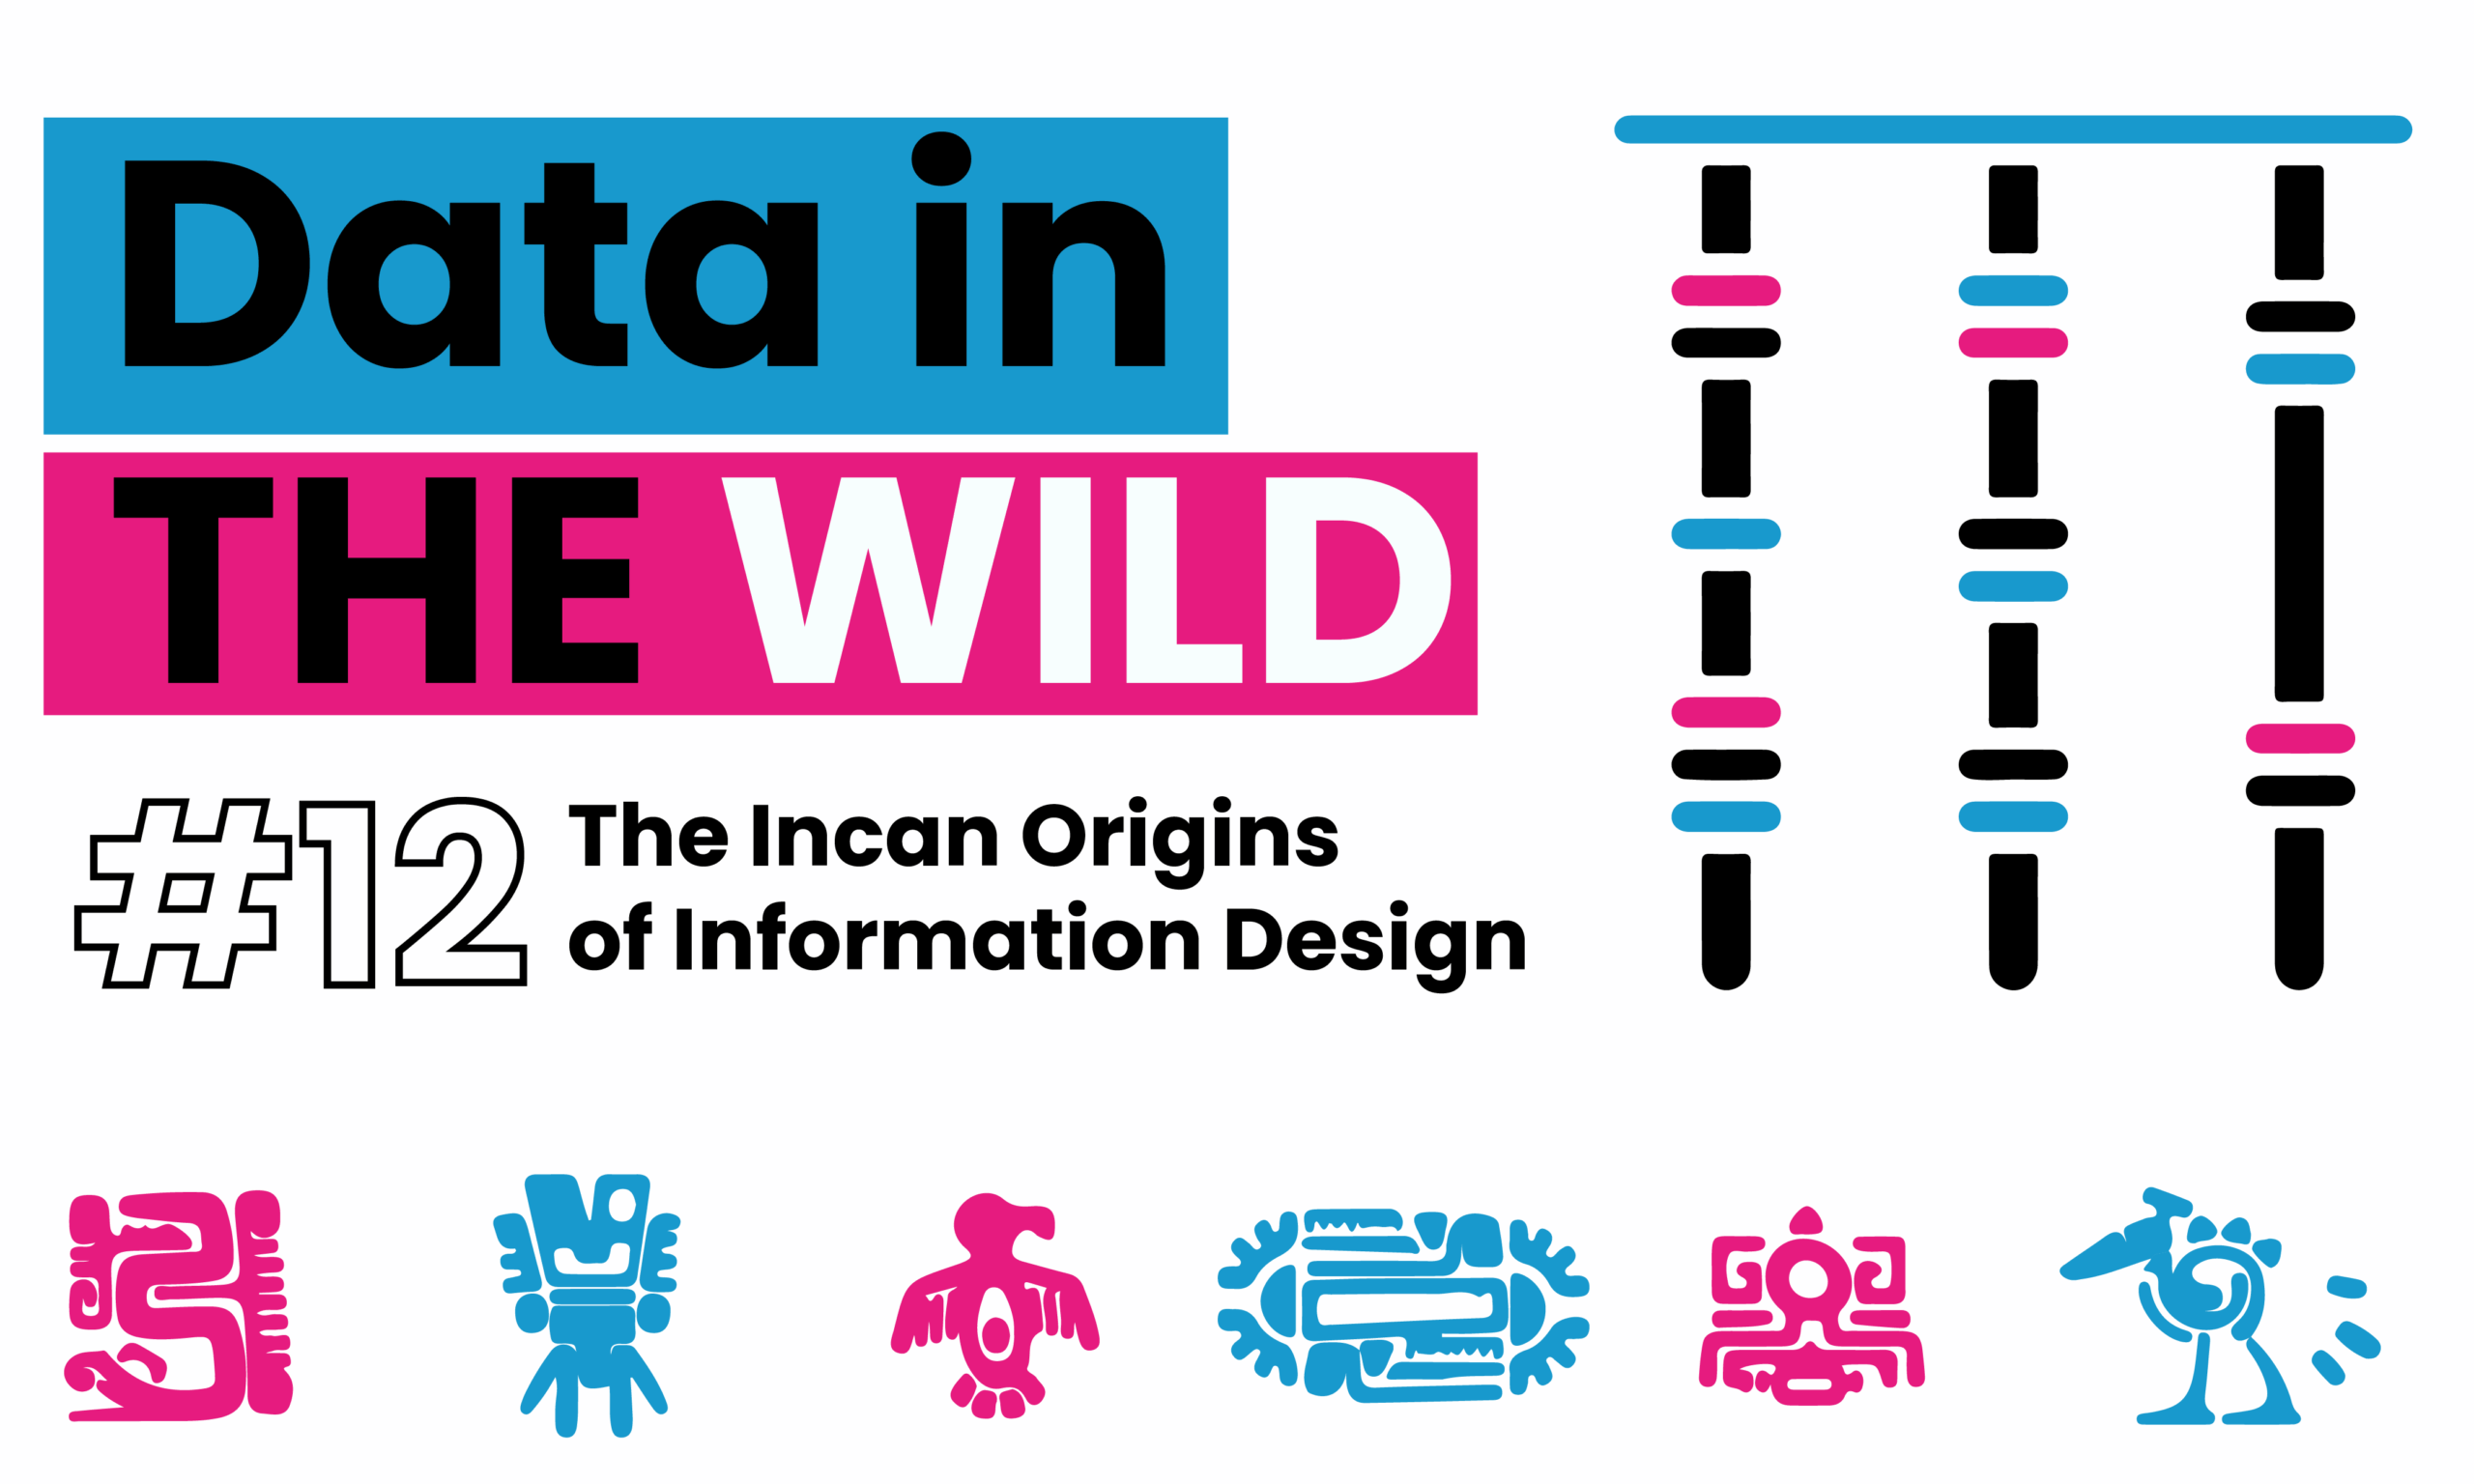
Data in the Wild #12: The Incan Origins of Information Design
Ancient Andean cultures used quipus knotted strings as a powerful form of data encoding. Long before spreadsheets, these tactile tools tracked census data, resources, and stories. Each knot carried meaning. Portable, durable, and deeply structured, quipus are a forgotten ancestor of modern data viz reminding us that information has always needed form.
Data in the Wild #8: Following Digital Footprints
In this edition of Data in the Wild, we explore how footfall data helps cities see without watching. From pandemic planning to crowd control at major events, learn how our phones quietly shape urban life and why data visualisation is the key to making sense of it all.