
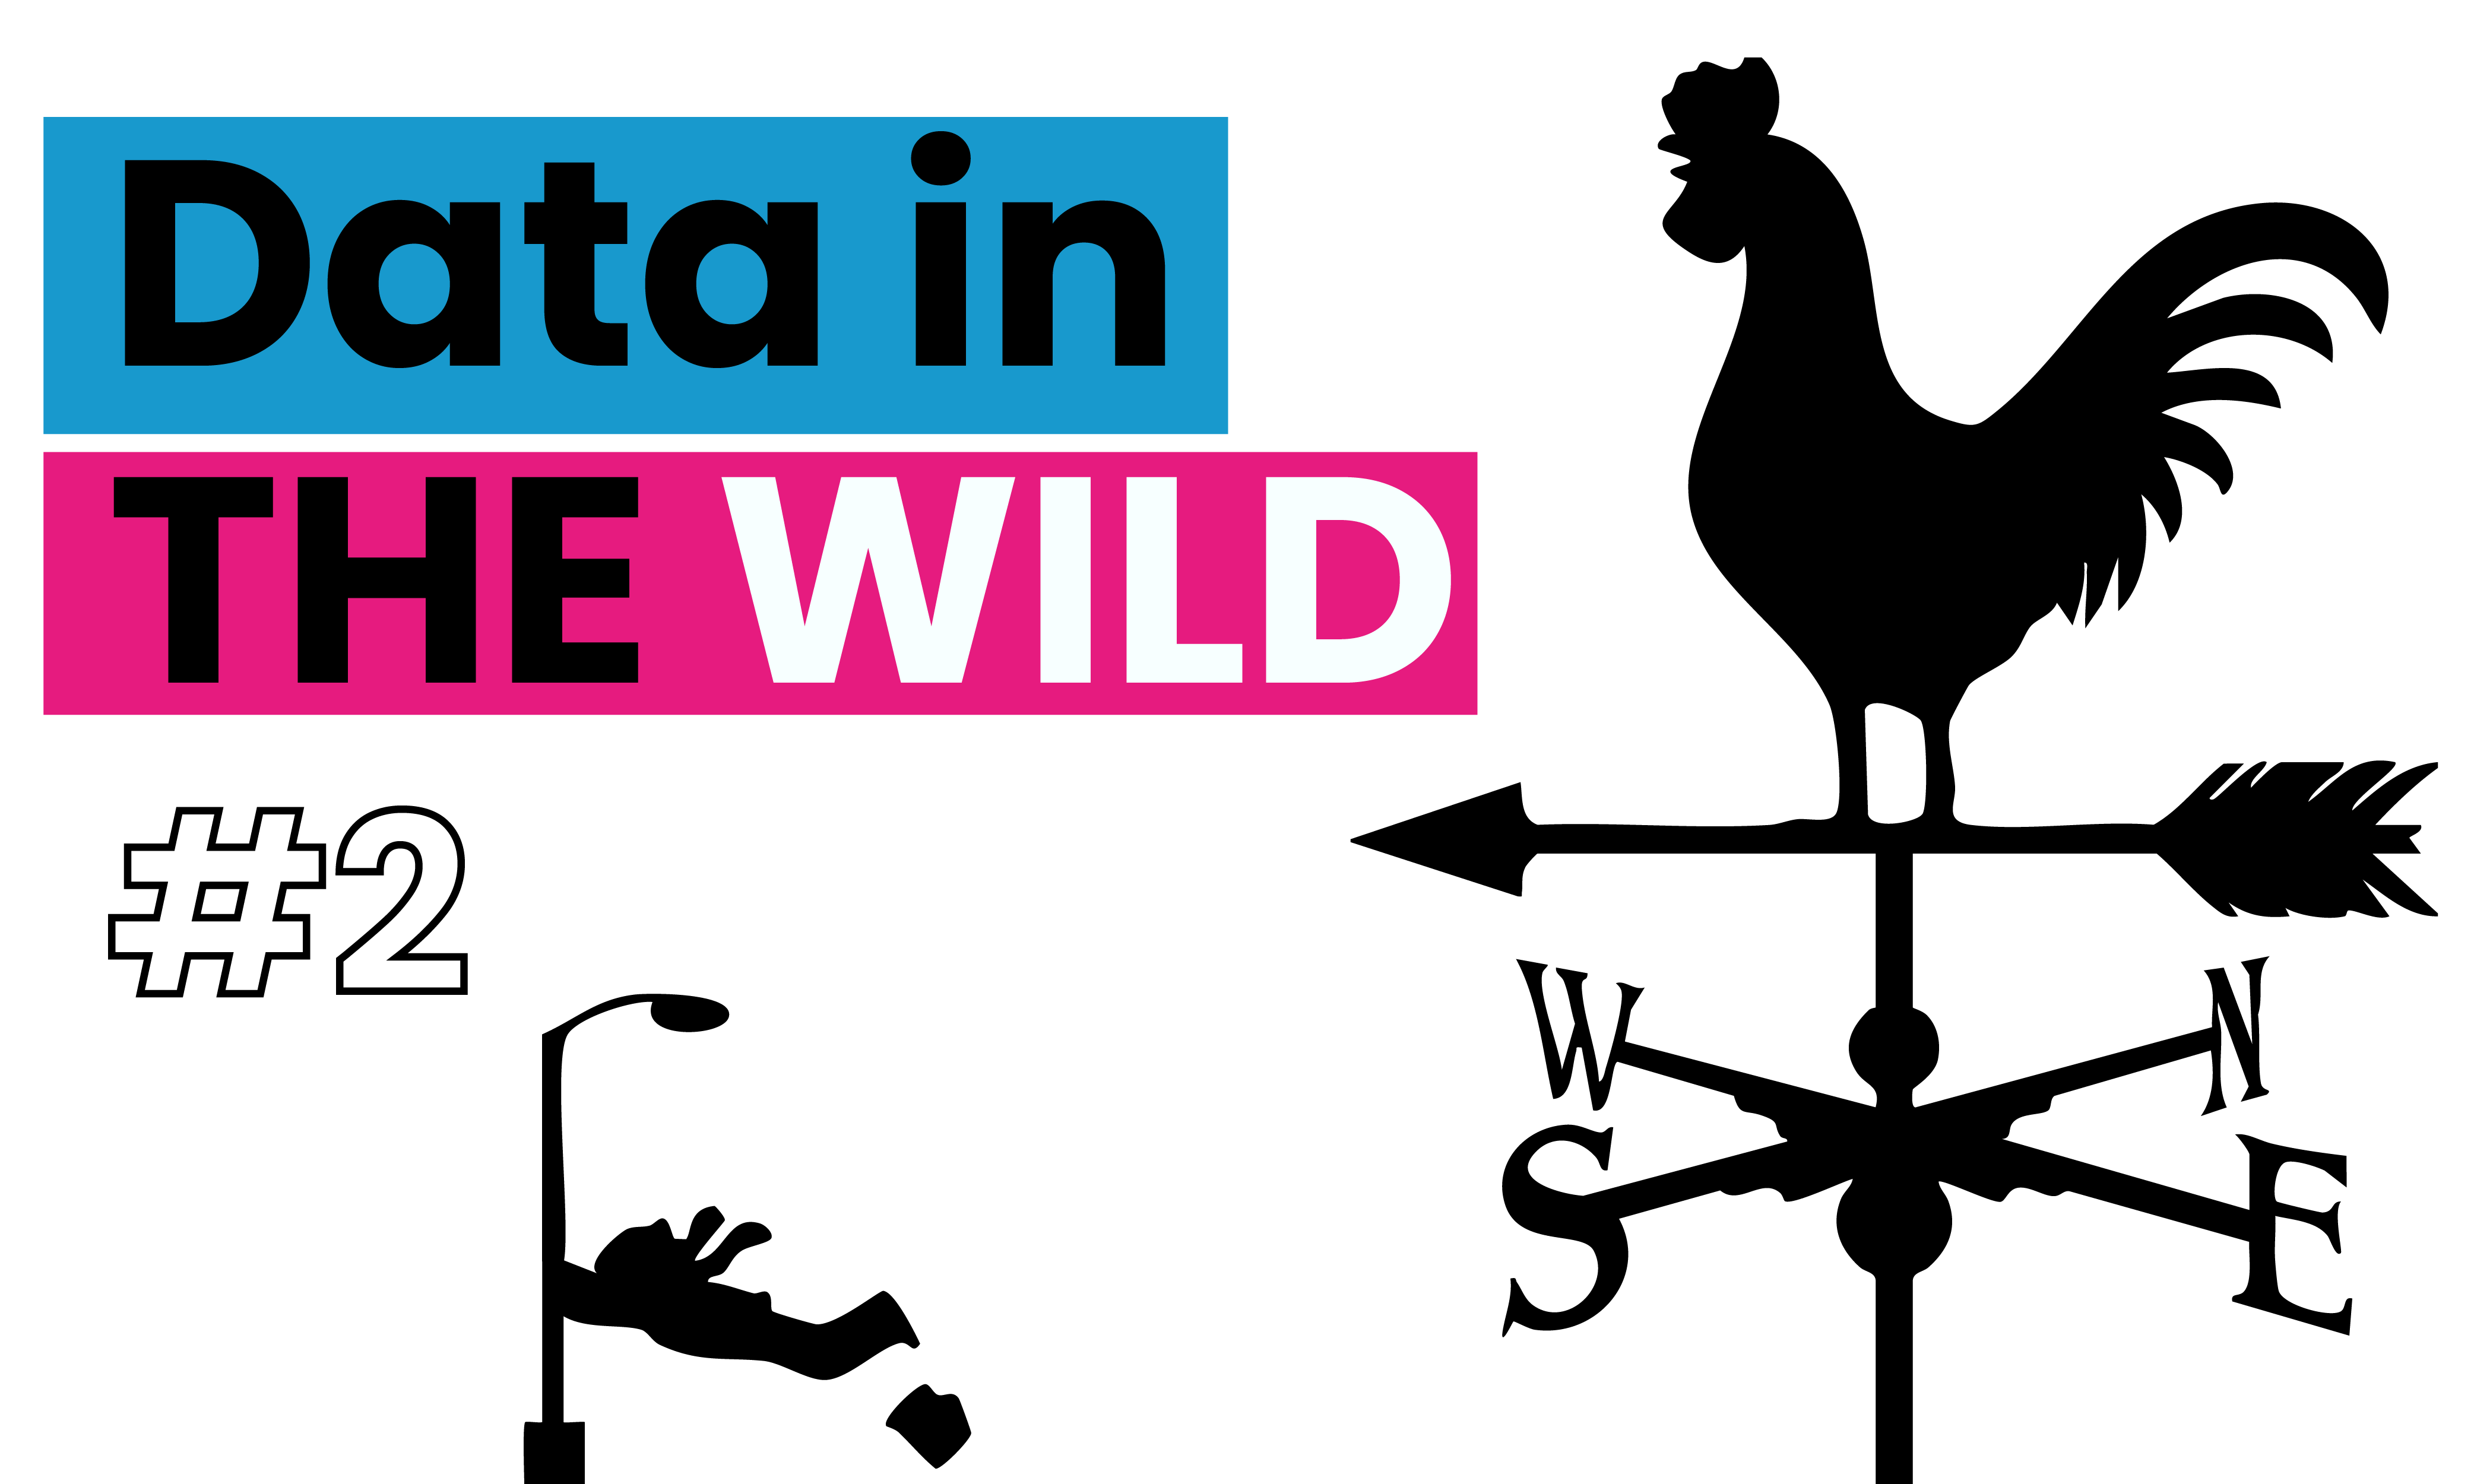
Data in the Wild #2
We’ve been visualising wind data for over 2000 years, have you ever wondered how such data viz can be used for you? Read this next part of data in the wild

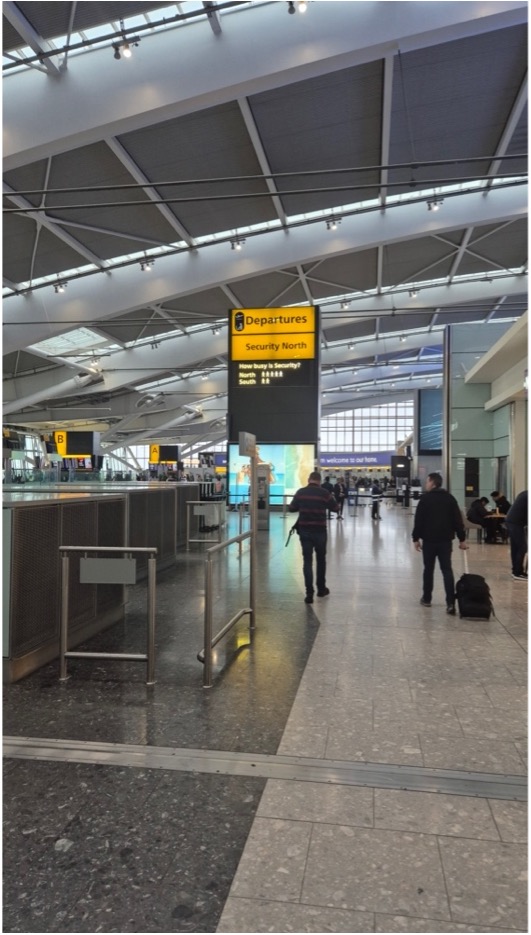
Data in the Wild #1
This is a series of guest posts from Obinna Iwuji about experiencing data and graphical displays of that data in the wild.
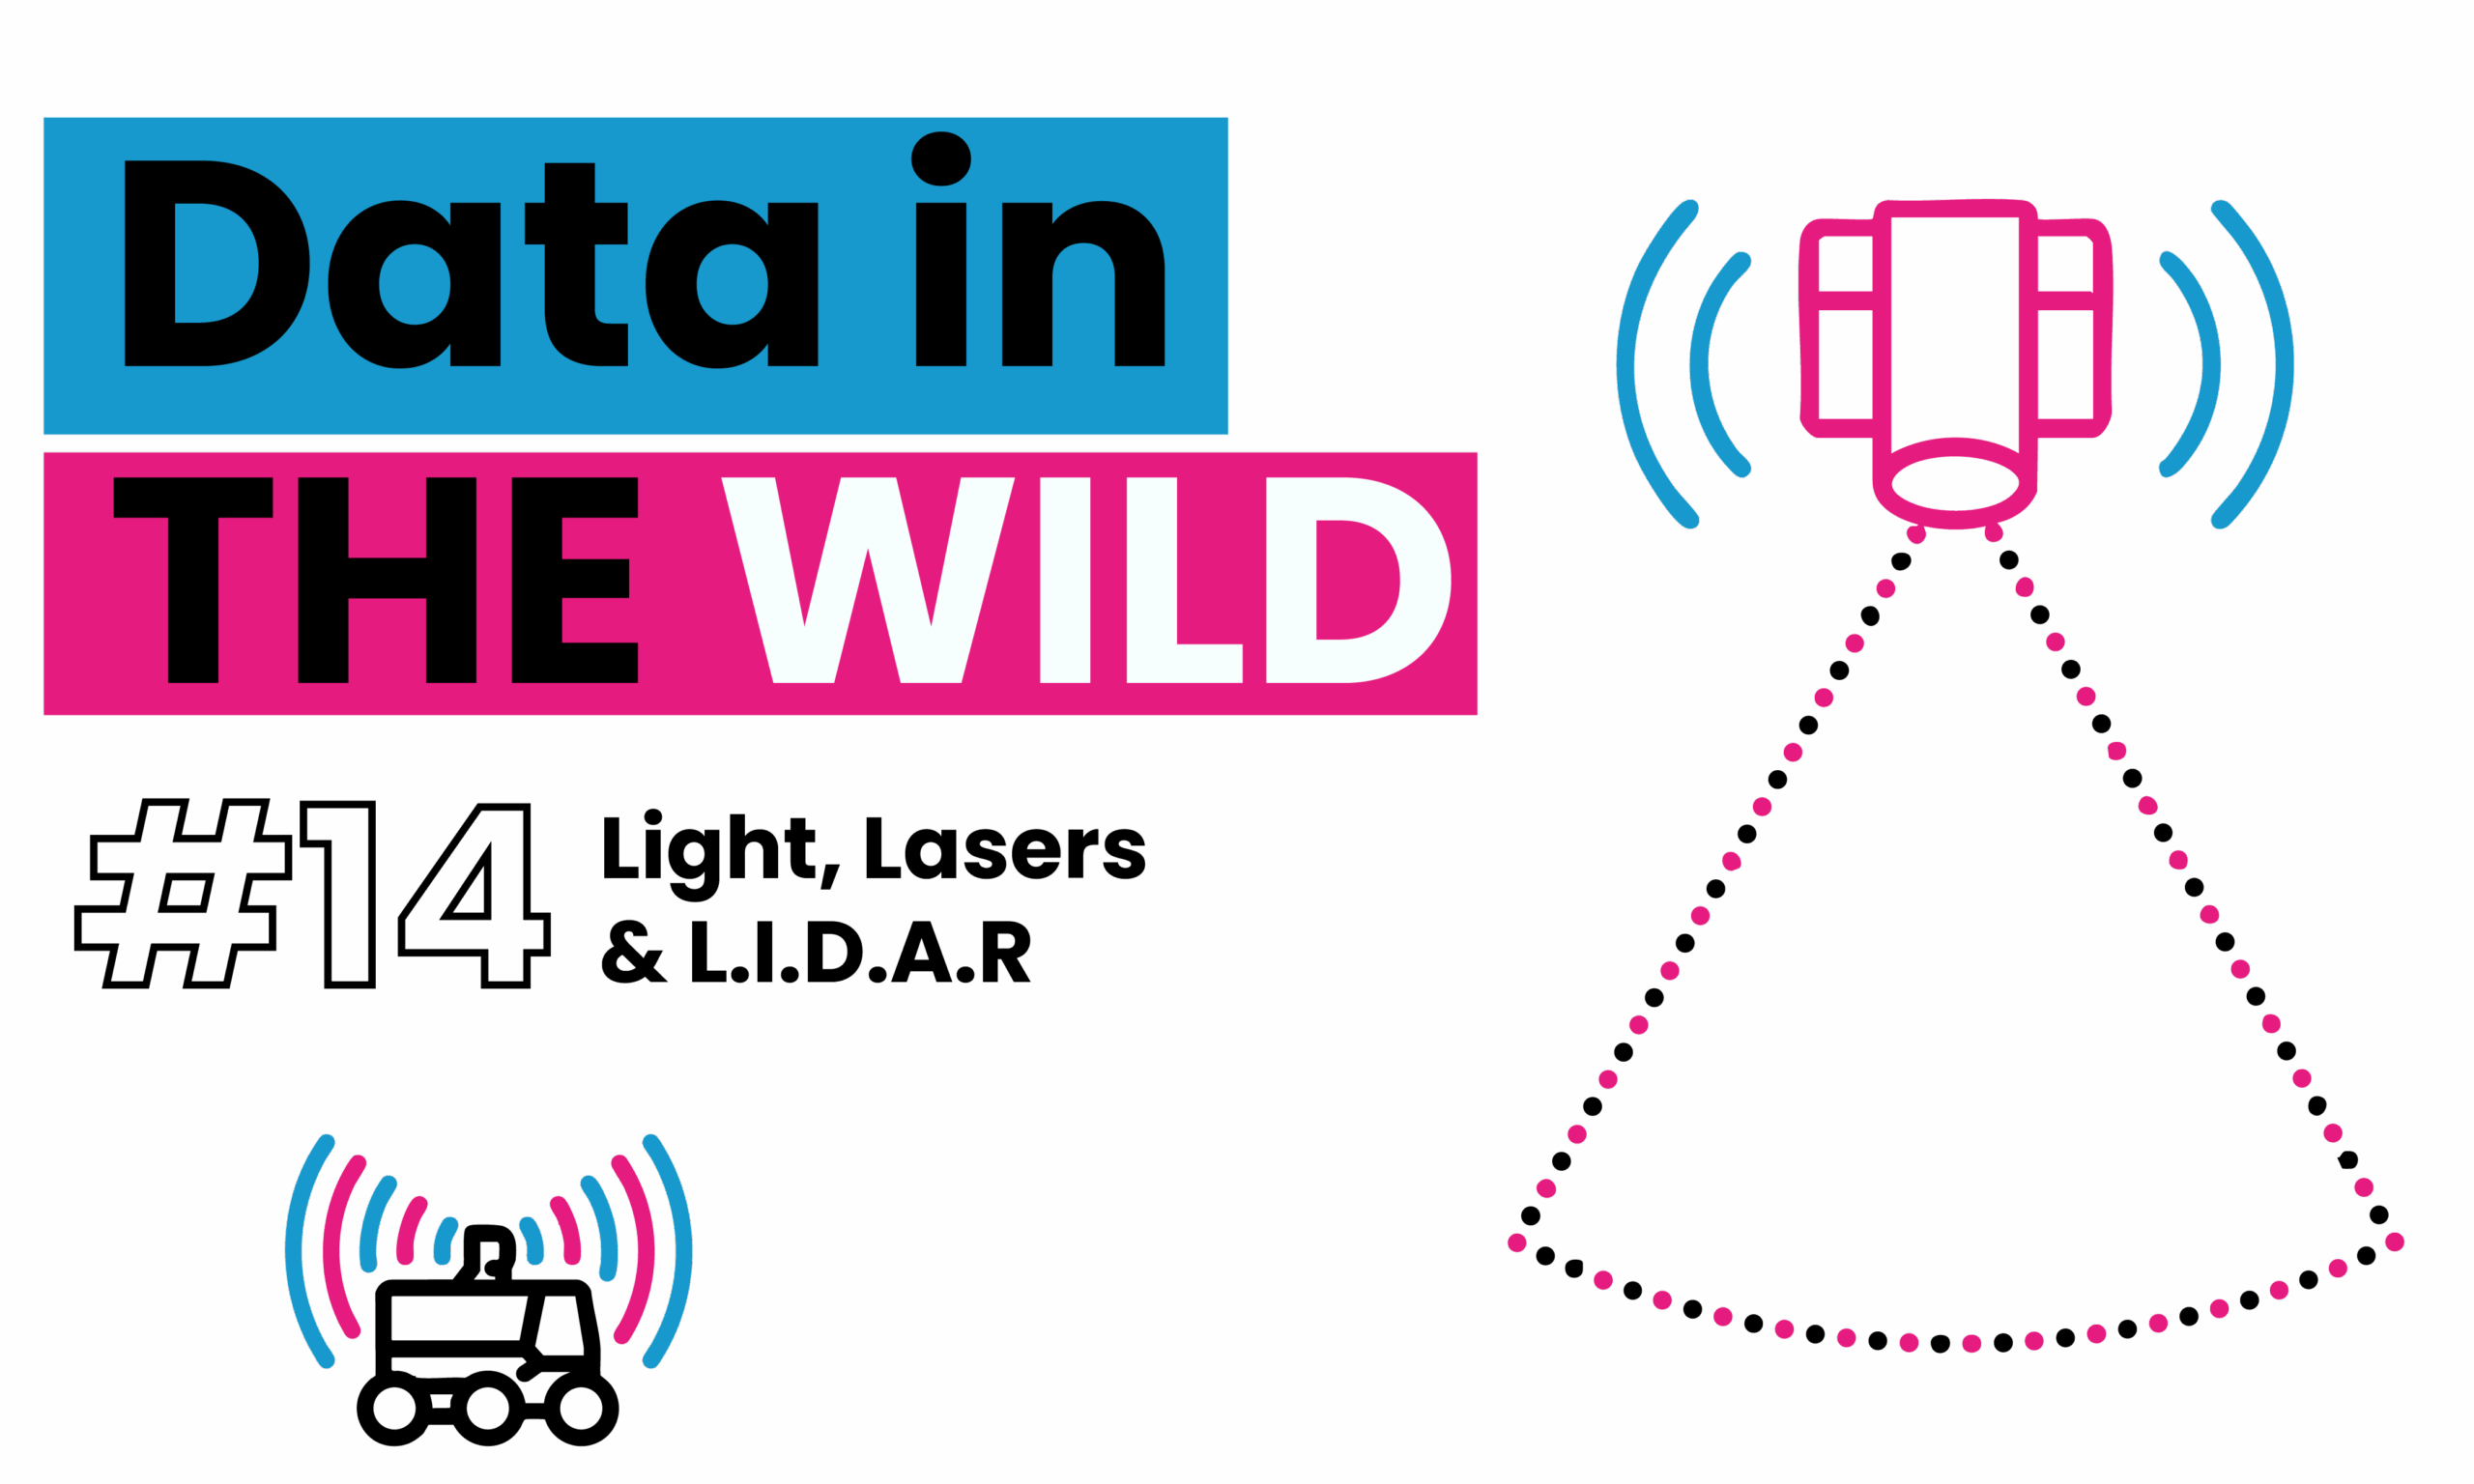
Data in the wild #14: Light, Lasers & LIDAR
Imagine mapping the world using light. That’s exactly what LiDAR does. It fires laser pulses that bounce off objects and return to a sensor, calculating distances with GCSE-level physics. Repeating this millions of times creates point clouds detailed 3D maps. From mapping cities to powering self-driving cars, LiDAR reveals the invisible.
