
In order to sprinkle some star dust into the contents of my book I’ve been doing a few interviews with various professionals from data visualisation and related fields. These people span the spectrum of industries, backgrounds, roles and perspectives. I gave each interviewee a selection of questions from which to choose six to respond. This latest interview is with Scott Murray, a designer, author and educator working in the learning group at O’Reilly media. Thank you, Scott!
Q1 | What was your entry point into the field: From what education/career background did you transition into the world of data visualisation/infographics?
A1 | As an undergrad, I majored in environmental studies, or, actually, “environmental theory,” which was a self-designed major I invented because my college didn’t yet have environmental studies. The idea was to study environments and how individuals and groups of people situated themselves within those spaces. It sounds far away from visualization, but to me they are both about considering context, expectations, values systems, and perception. Professionally, I worked as a self-taught web designer for several years until I took Tufte’s day-long course and decided I needed to quit and do something more visually creative. (The web wasn’t a super visual place back then!) I went to grad school at MassArt’s Dynamic Media Institute, where my advisor Jan Kubasiewicz suggested I check out this new tool called Processing out of MIT. I spent my first winter break learning how to create interactive things with Processing, and that January I exhibited my first project: the ASCII Photo Booth, still one of my favorites. Through Processing I learned about Ben Fry’s work, and Stamen and a handful of other firms that were just starting to do mapping and visualization projects. It was exciting stuff, and, combined with the open data movement, it seemed the world of data vis was just about to burst open. Happily, it did!
Q2 | What is the single best piece of advice you have been given, have heard or have formed yourself that you would be keen to pass on to someone getting started in a data visualisation/infographics-related discipline?
A2 | Create something today, and publish it online today. Then repeat that process every day. You are bound to push yourself, learn a great deal, and make connections with the people whose work you admire. Invariably, people who are new to visualization want to know where to begin, and, frankly, it’s understandably overwhelming. There is so much powerful work now being done at such a high level of quality, that it can be quite intimidating! But you have to start somewhere, and I don’t think it matters where you start. In fact, it’s best to start wherever you are now. Start from your own experience, and move forward. One reason I love this field is that everyone comes from a different background — I get to meet architects, designers, artists, coders, statisticians, journalists, data scientists… Data vis is an inherently interdisciplinary practice: that’s an opportunity to learn something about everything! The people who are most successful in this field are curious and motivated. Don’t worry if you feel you don’t have skills yet; just start from where you are, share your work, and engage with others.
Q3 | We are all influenced by different principles, formed through our education, experience and/or exposure to others in the field – if you had to pick one guiding principle that is uppermost in your thoughts as you work on a visualisation or infographic, what would it be?
A3 | Context is key. You’ll hear that the most important quality of a visualization is graphical honesty, or storytelling value, or facilitation of “insights”. The truth is, all of these things (and others) are the most important quality, but in different times and places. There is no singular function of visualization; what’s important shifts with the constraints of your audience, goals, tools, expertise, and data and time available.
Q4 | Following the research you did last year, what are your reflections on the perceived importance of following a working process: Do the people you interviewed genuinely place an importance on observing some sort of workflow in their work OR were there more people who felt having an open/freestyle approach suited them better? Was there a sense of a process being like bicycle stabilisers: You need one when you start out but as you advance you become more adept without? Or is it as you grow it just becomes second nature?
A4 | My sense so far is that a clearly defined process is much more important for teams (like design firms) than individuals (like freelancers). This is a generalization, but in a team, expectations and responsibilities need to be clear. For some teams, the process is documented and made explicit, while for others it evolves organically in response to the demands of a given project and the skills of each team member. Individuals certainly benefit from clarifying their own processes, if only because it helps them identify what works well (or not) for them. But individuals also have the luxury of being more reactive, and taking action without running decisions by collaborators, so, in a sense, their “process” may be implicit, just the way in which their internal decision-making abilities express themselves.
Q5 | As somebody who is involved in educating others, what are your observations about what attributes separate the successful students from the rest of the pack? What capabilities are you most eagerly looking for as they enter the programme – or during – to decide if that person has got ‘it’?
A5 | Successful students have four legs, hooves, and a single horn protruding from their forehead! No, I disagree with the “unicorn” ideal that says to be great you need to be able to understand everything and do everything. Successful students are curious and highly motivated. Without curiosity, you won’t care about the project, and you won’t ask all the questions that need to be asked. (If you are not curious, this is not the right field for you!) Without motivation, you won’t keep pushing yourself to learn new things, to try yet another approach, to ask for help from others when you need it. You don’t have to be a math genius or design whiz to be great at visualization, just curious and motivated.
Q6 | If you could somehow secure 3 months to do anything you wanted, what would you love to be able to spend your time doing to enhance your data visualisation capabilities further? (Eg. Reading, making, learning code etc.)
A6 | Learning basic statistics; learning proper mathematics; catching up on reading; pursuing that backlog of personal projects; and traveling to visit people whose work I admire, interview them, and observe them at work in their studios.
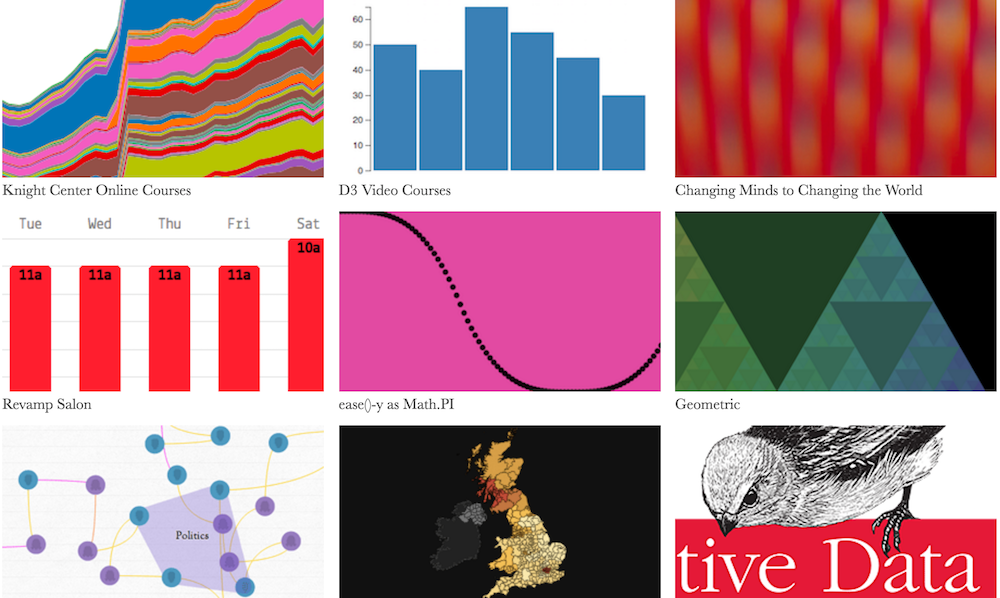
Header image taken from Scott’s extensive and varied collection of previous work.
