In order to sprinkle some star dust into the contents of my book I’ve been doing a few interviews with various professionals from data visualisation and related fields. These people span the spectrum of industries, backgrounds, roles and perspectives. I gave each interviewee a selection of questions from which to choose six to respond. This latest interview is with Paolo Ciuccarelli, Scientific Director at DensityDesign Research Lab – Politecnico di Milano. Thank you, Paolo!
Q1 | What is the single best piece of advice you have been given, have heard or have formed yourself that you would be keen to pass on to someone getting started in a data visualisation/infographics-related discipline?
A1 | Meaning is built (designed), not extracted. Meaning and sense are not in the data: they will – or will not – exist in a kind of “space” between the visualization (and behind it the data) and the mind of its users/readers, as a combination of what they see and what they think. That’s why I don’t like that much the emphasis on ‘Data Mining’: it’s just one step in a much broader process; and that’s way I love the term “sense-making”: we have to “make” it, and – before that – “design” it.
Q2 | When you begin working on a visualisation task/project, typically, what is the first thing you do?
A2 | If it’s a (big) project I immediately ask the client how much time do they have to dedicate to the project. Often they didn’t even think to that, and especially for exploratory projects (i.e. exploring the data in search for meanings) it’s fundamental.
Q3 | We are all influenced by different principles, formed through our education, experience and/or exposure to others in the field – if you had to pick one guiding principle that is uppermost in your thoughts as you work on a visualisation or infographic, what would it be?
A3 | A visualization is always a model (authored), never a mould (replica) of the real. That’s a huge responsibility.
Q4 | As somebody who is involved in educating others, what are your observations about what attributes separate the successful students from the rest of the pack? What capabilities are you most eagerly looking for as they enter the programme – or during – to decide if that person has got ‘it’?
A4 | Curiosity, first. Then the will and the capabilities to cope with the technological side/components. Coding (more as a logic than a technical task) is becoming a very important component for designers working in the field. It doesn’t necessarily mean that you need to code to work in the field, but it helps a lot. I think the profile in the future will be hybrid, mixing capabilities now separated into disciplinary silos.
Q5 | What do you feel is still the big unknown in data visualisation? If you could undertake one research project (assume any funding needed, plenty of time, good collaborators, justification are all in place) what do you feel would make the biggest difference to the field at large?
A5 | The research project would be how to make visible the metadata of data: how can we visualize what is behind the data: how this data has been extracted or precessed, what is the level of uncertainty of these processes and of the data itself; where the data come from (source) … and some of them could have different values at once: a data could be uncertain for different reasons (time – e.g. exact date of a know connection between two people – and source…) these are all aspects of the data that certainly would contribute to make sense of it but we don’t usually show.
Q6 | If you could somehow secure 3 months to do anything you wanted, what would you love to be able to spend your time doing to enhance your data visualisation capabilities further? (Eg. Reading, making, learning new tools etc.)
A6 | Improving coding capabilities and do (more) things (hands-on): given my position at the university and within the research lab (DensityDesign) I don’t have the time I would like to have to go deep into all the projects. I was used to code in the past, so I know how it works, but between knowing and doing in this case there is a difference, given also the importance of prototyping in designing data interfaces. As I said once “if you don’t code someone else is doing it for you”, meaning that in most (if not all ) the projects we’re involved in there is always a coding component, that someone should take care of, and I think this is a clear trend for the future.
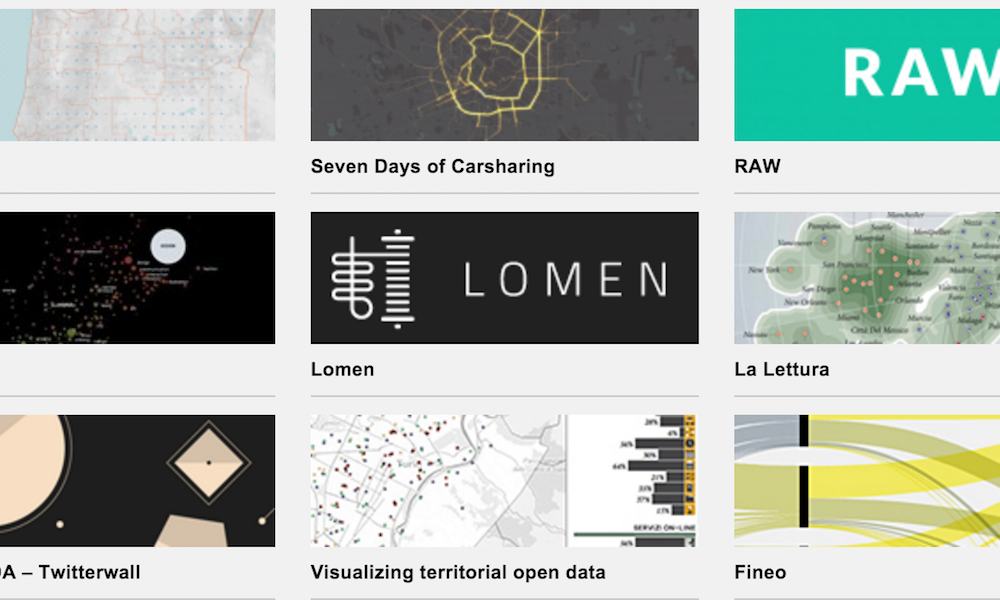
Header image taken from Density Design’s Research page.

