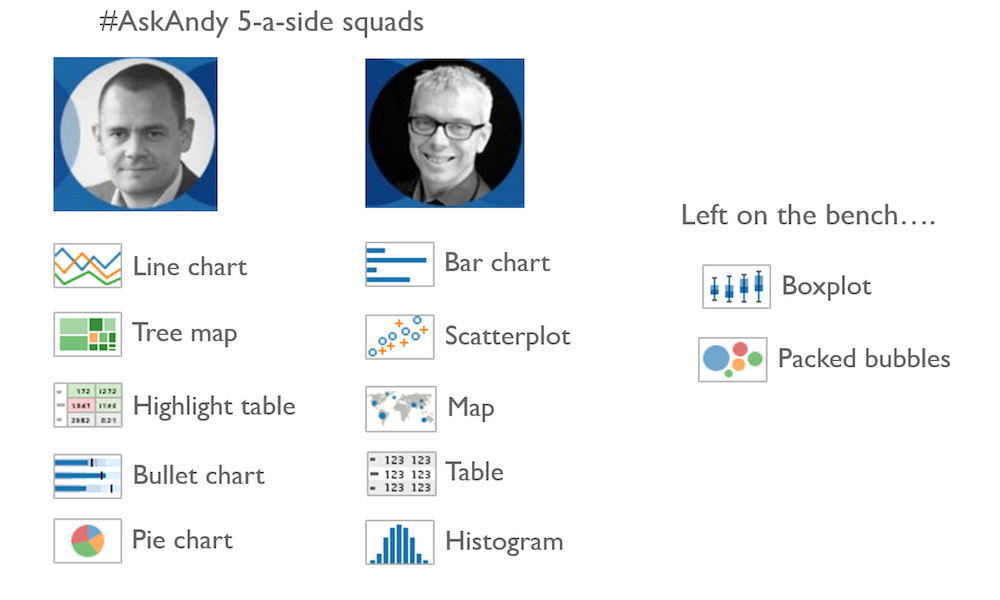
On Monday I had the pleasure of joining Andy Cotgreave for a special webinar, hosted by Tableau, titled ‘Ask Andy Anything’. As I explained recently, this was a chance for people to send in any burning questions they had about data visualisations and we’d offer our views.
An on-demand recording of the session has now been released by Tableau and you can access it here. Thank you to all who contributed questions and tuned in to watch us attempt to find articulate answers!
Check out Andy C’s website for a few posts that offer further resources to supplement some of our answers, dissect the 5-a-side chart picks we made and also respond to some questions we ran out of time to answer.

