
References for visualising uncertainty
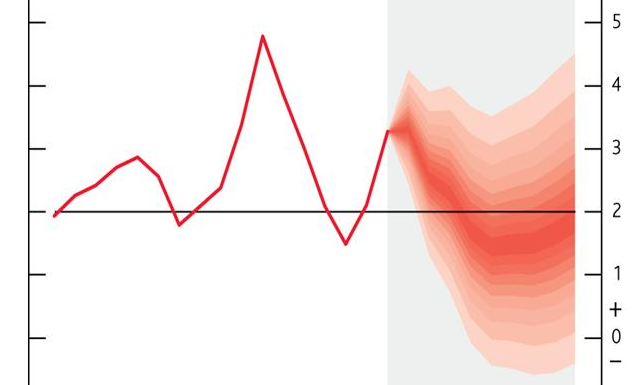
One of the frequent questions I get asked, particularly by people from a scientific or financial domain, is how to effectively visualise uncertainty of data and of statistics. My response is usually to make suggestions around annotated markings and/or colour gradients to indicate increasing or declining certainties.
References for visualising uncertainty Read More »
