
To mark each mid-year and end-of-year milestone I take a reflective glance over the previous 6-month period in the data visualisation field and compile a collection of some of the most significant developments. These are the main projects, events, new sites, trends, personalities and general observations that have struck me as being important to help further the development of this field or are things I simply liked a great deal. Here’s the full compilation of all my collections.
At the end of December I published a collection for the last 6 months of 2013 and now I’d like to reflect on the opening 6 months of 2014. I look forward to hearing from you with suggestions for the developments you believe have been most significant.
And so, as ever, in no particular order…
1. The Reshaped Economy in 255 Charts
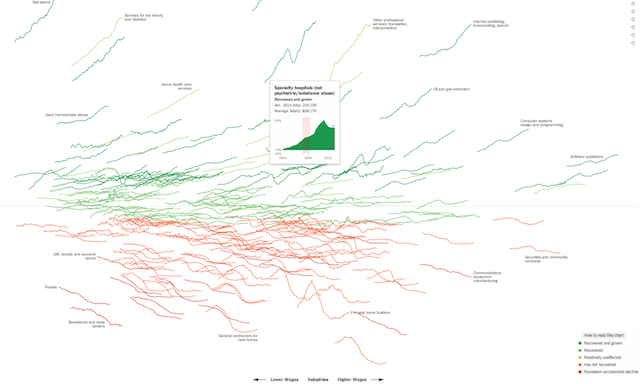
‘How the Recession Reshaped the Economy, in 255 Charts‘ is sharing the ‘pièce de résistance de 2014’ prize so far and probably stands up well against anything else produced in recent memory. It is a modern masterpiece, supremely conceived and executed interactive graphic produced by Jeremy Ashkanas and Alicia Parlapiano for TheUpshot (more later), showing how job numbers have fared across 255 different industries in the past 10 years. Pigeonholing it is hard: it is a small-multiple-scatterplotted area charts extravaganza. Some of the tool-tip interactivity detail is extraordinary, which kind of makes the single complaint – that of the colour scale failing on the red-green issue – a slightly surprising oversight, albeit the position and direction of the charts provides the main encoding.
2. Visualising MBTA Data
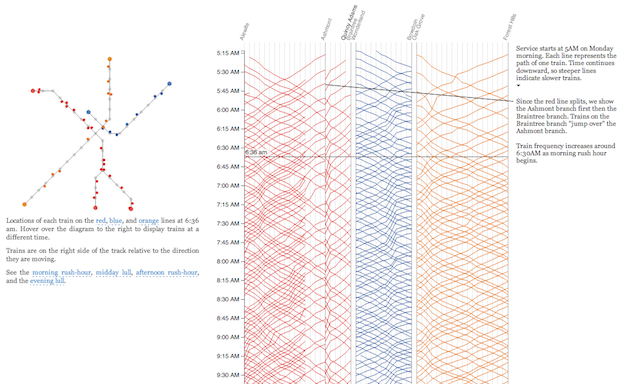
As I stress above, there is no significance to the ordering of the items in the list (which actually goes against everything I teach, but we’re all human). This next work – Visualizing MBTA Data – is at number 2 but has to be mentioned in the same breath as above project. This beautifully crafted exploration of Boston’s subway system by Mike Barry and Brian Card must share the acclaim with the ‘255 charts’ project. It is perfection, one of those projects you simply dream of having in your portfolio. Created ‘to help people in Boston better understand the trains, how people use the trains, and how the people and trains interact with each other’ this project provides incredible levels of intricate detail, design attention and elegance in interaction across several sections of content. Let me leave you with the fact that this was produced for a graduate course at WPI – bravo to Matthew Ward as the programme’s data visualisation teacher.
3. Data Journalism Sites
It has been impossible to ignore the emergence – in a very similar timeframe – of new data journalist organisations/entities led (in profile terms) by Nate Silver’s FiveThirtyEight, Vox, and the New York Times’ Upshot. It is still, of course, early days for each of these entities to bed themselves in and establish a clear raison d’etre. Indeed there has been quite a lot of criticism (very good articles by Alberto and Brian Keegan) about the output they have demonstrated to date, even if most observers accept this is quite an exciting and potentially disruptive development in the journalism space. This overview from Nate Silver for the launch of FiveThirtyEight offers a good guide for what to expect over the coming months, with similar intros from David Leondart for The Upshot and Ezra Klein for Vox. Watch this space with interest.
4. Storytelling Discourse
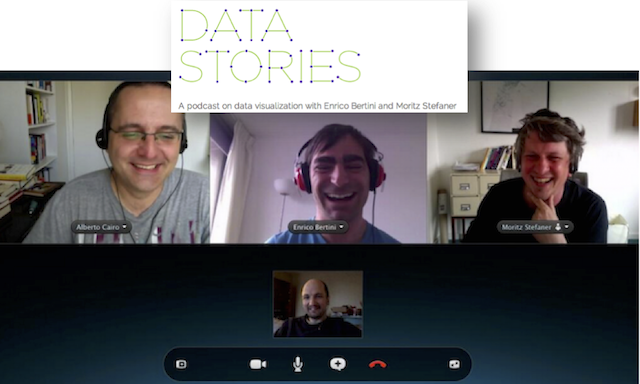
Through a reflective lens the phrase ‘hot topic’ tends to mean one of two things: short term gimmick or a concept that is being strongly debated. You tend to only strongly debate things that have some kind of traction and that is certainly what ‘storytelling’ as a concept feels like. We’ve been nibbling around the edges of this issue for a year or two but this past few months really saw some more concerted efforts at refining the definitions, applications and role of storytelling in data visualisation. If my memory of the precedents serve me correctly, here is the story… Moritz Stefaner kicked things off with an astutely timed bit of trolling during Tapestry Conference 2014 and then walked-the-walk with a well argued article about ‘Worlds, not stories‘. At the same time Dino and Kim of Periscopic were respectively rocking-boats with a ‘Framework for Talking about Data Narration‘ and ‘Talking Numbers at Visualized‘. Lynn Cherny weighed in with her piece ‘Implied Stories (and Data Vis)‘ later followed by ‘Data Characters in Search of An Author‘. Robert Kosara made two contributions with the skillfully framed ‘Stories Are Gateways into Worlds‘ and then ‘Story: A Definition‘. Then we had the summit meeting with the Data Stories episode 35 (constructive) clash of perspectives involving Moritz, Enrico Bertini, Robert and Alberto Cairo. Alberto wrote up his thoughts ‘Annotation, narrative, and storytelling in infographics and visualization‘. We then had follow up reflection/discussion pieces from Jeff Clark, Andy Cotgreave and Jon Schwabish. Additionally, for reference, in the past Cole Nussbaumer (as her site/twitter name suggests) has discussed at length the issue of storytelling with data. I’m sure many others have too, apologies that I can’t include everyone’s stories in this summary paragraph…
5. Lyra
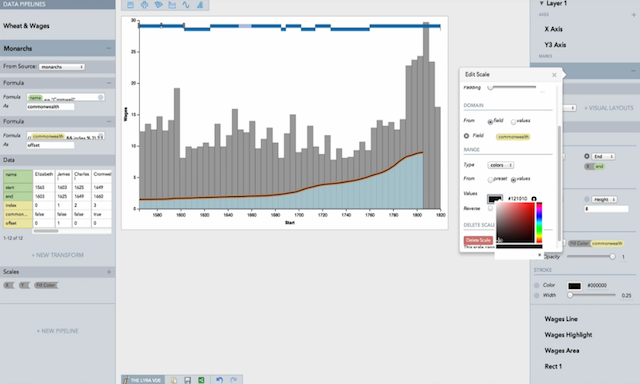
You can’t fail to have noticed the buzz around the conference circuit this year caused by the early demonstrations of Lyra, or officially the ‘Lyra Visualisation Design Environment (VDE)’, an interactive environment that “enables custom visualization design without writing any code”. Lyra is emerging from the same research lab (supervised by the omni-brilliant Jeff Heer) that brought Protovis and D3 to the field and comes from the significant brain of Arvind Satyanarayan. Arvind has done a great job of introducing the tool over the past few months which aims to offer “more expressive than interactive systems like Tableau, allowing designers to create custom visualizations comparable to hand-coded visualizations built with D3 or Processing”. Here is a short demo video to see the environment and output, a paper giving more detail, Jim Vallandingham (the king tutorialiser) has produced an insanely good tutorial already and John Burn-Murdoch has been giving it a run out in some of his work at the FT.
6. Wee Things and Two Little Ducks
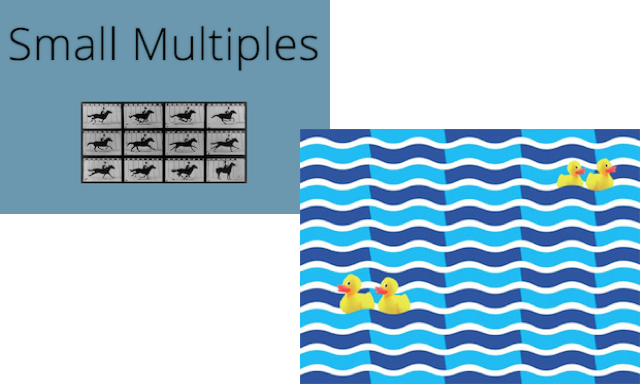
Unlike last year, I’ve actually managed to attend a number of conferences already this year and have witnessed a deluge of great talks. I’ve also watched many of the recordings and read the increasingly-trendy (and thank god because its brilliant) slide narratives. There were two talks in particular that absolutely chimed with every ticking cog in my visualisation head, and indeed were talks I didn’t actually witness in person. Jonathan Corum is responsible for some of the very best presentations in this field. I’ve never had the pleasure of attending one of his sessions but if the intricate detail of his write-ups (and incredible body of work) are anything to go by they are must-see events. His talk at Malofiej titled “Two Little Ducks” was a magnificent piece of work, superbly framed and sequenced and oozing with valuable insight at every turn. The second talk came from Lena Groeger at OpenVisConf. At the time of Lena’s talk I was sat with Robert Kosara in a taxi heading for the airport bemoaning the fact we were missing it! I have since had the opportunity to watch the video of Lena discussing ‘A Few of My Favourite Wee Things‘ and gone through a companion slide deck/collection of ideas and it is everything I hoped it was going to be: a creative and comprehensive glance through the many different issues of ‘tiny’ in visualisation design. It is just ‘right up my street’, as the saying goes. A special mention too for Jon Schwabish’s short story at Tapestry discussing ‘Goofy Comparisons‘.
7. Washington Post Graphics Goodness
The Washington Post Graphics team has never been better. Under the Directorship of Kat Downs Mulder, the work coming from their multi-talented team deservedly places them right at the top table of this field alongside their New York rivals counterparts. I can’t profile all the staff in one go but people like Katie Park, Darla Cameron, Denise Lu and Kennedy Elliott (to name but a few) are some of the brilliant people you should be following. You’ll notice that is a stream of female names: it shouldn’t need to be noticeable or need surfacing as a ‘thing’, but in a field of 3 males to every 1 female it is something that is important to celebrate. There are some very good human men in the team, also. Richard Johnson‘s arrival has certainly introduced a special new ingredient to the mix (especially with his incredible illustration skills) as has the prolific and talented Christopher Ingraham who is firing out some great stuff on the Wonk Blog and the fascinating companion site ‘Know More‘.
8. Bloomberg’s Tracking Super Bowl Tickets
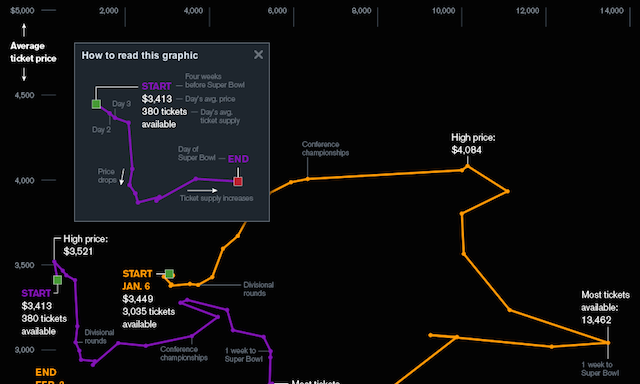
I’m a sucker for connected scatter-plots and this was one of the best I’ve seen by the Bloomberg Visual Data Team showing the daily price and secondary market volume of Super Bowl tickets. There’s so much to admire with this graphic, such as the ghosting background comparisons, the annotated extremes but one of my favourite features is simply the ‘How to’ pop-up. With visualisation literacy very much on my mind right now, the coaching this helpful guide provides is excellent – helping viewers understand how to make sense of the shape, direction and trajectory of the connected story. It really preserves the potential of this appropriately chosen graphic device to be understood and I think that is a great sign.
9. WSJ’s ‘How does 3D printing work?’
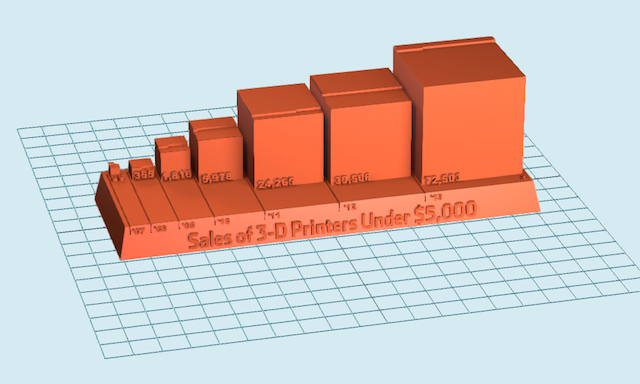
This entry is very much filed under ‘one to watch’. On the basis that this collection is about things that I reckon are significant, either as case studies of great work or trends in the field, my spidey senses tell me this might be something we see more of in the future. The Wall Street Journal’s guide to 3D printing also included a chart showing personal 3D printer sales, in 3D for you to download and print, in 3D! As the home 3D printer becomes a commodity, maybe the graphics of our near future will have exportable, home-printable 3D downloads as routine, just as we have data downloads right now.
10. Success of the NYT Dialect Map
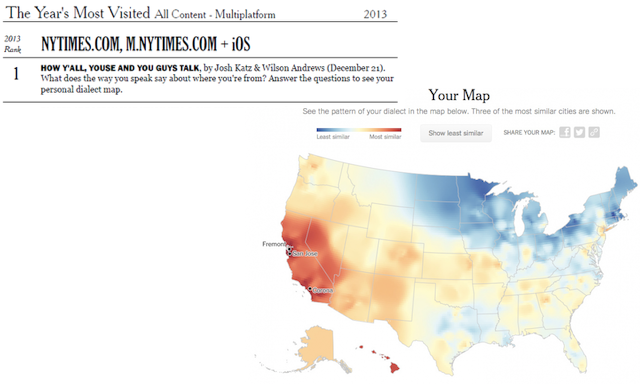
The interactive Dialect Map ‘How Y’all, Youse, and You Guys Talk’ by Josh Katz and Wilson Andrews was released on December 21, 2013. (“Andy, that’s out of scope for this collection. Idiot!”, you cry, prematurely). In the 11 days it was online during 2013 it became THE most visited New York Times web pages of 2013 (via the Atlantic). Just let that sink in. A staggering success story, as I discussed in more detail in February.
Special mentions…
Here are the other highlights from the first half of 2014 that deserve a special mention:
NYT Sochi Collection | Easy to be complacent about the ongoing brilliance of this department’s output, another genius portfolio of work, this time from the Sochi winter olympics.
News Vis | A very useful, explorable collection curated by Robert Kosara of the best visualisation and infographic output from news and media organisation.
Data Visualization Checklist | A super useful checklist developed by Stephanie Evergreen and Ann Emery to guide folks towards more effective data visualisation constructions.
World Cup league representation | There was a lot of good stuff produced during the World Cup but this was amongst my favourites from the Guardian US Interactive team (primarily led by Kenan Davis) to show at each stage of the World Cup which leagues had the most representation amongst the remaining players still competing.
OpenVisConf | This interface created by Yannick Assogba is a wonderfully innovative way to share videos from conference events.
Letters in words | Graphing the distribution of English letters within words. Might not sound particularly exciting but it is a dead simple but engaging piece of analysis.
Scientific American Blog | I loved Jen Christiansen’s article ‘How I Reconciled My Love for Art and Science’
Tableau for the Mac | Relatively self-explanatory, just a very useful development opening up a very important potential user base (and making my life endlessly easier)
Atlas of Prejudice | Probably an off-beat choice but I liked it and it’s my list. So there.
Spurious Correlations | Just because.
