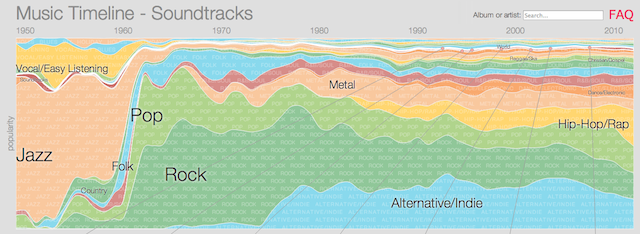
The Music Timeline is a new project from the Big Picture and Music Intelligence research groups at Google. The Big Picture group includes star names such as Fernanda Viégas and Martin Wattenberg. The Timeline is updated weekly and let’s you see how different musical genres grow or shrink in popularity through the years from a starting point of 1950. It also let’s users discover artists’ libraries from within each genre.
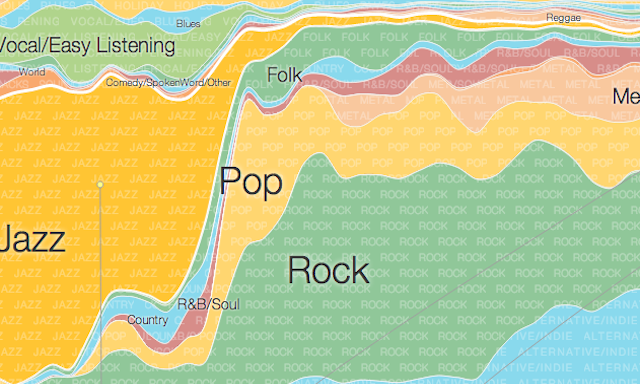
The visualisation exists, in the first instance, as an interactive stacked area chart, with the thickness of each genre determining its popularity over time and the colours used to differentiate between genres at the top level and the sub-genres beneath. The popularity data comes from Google Play Music and is based on the number of users who have an artist or album in their library. In the ‘About‘ description we see this explained: “The jazz stripe is thick in the 1950s since many users’ libraries contain jazz albums released in the 1950s’.
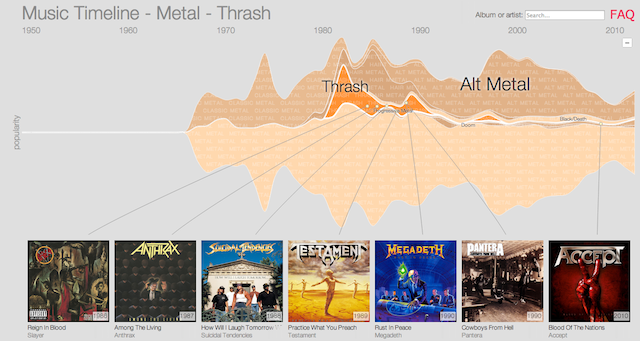
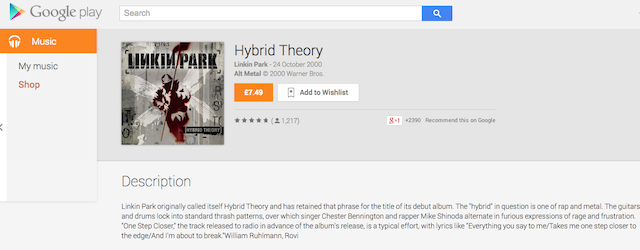
When you click on a certain genre, you are then taken to an interactive stream graph including more detailed sub-genre streams within the overall shape. Beneath the main graphic you have a selection of seven prominent albums/artists from down the years, though it is unclear on what basis these are selected (possibly top seven sales figures on Google Music?). Clicking on an album will take you through to the artist/album’s library.
Read more about the project including some of the key acknowledgements about the depth and state of the data.


