
Launched yesterday comes a new interactive visualisation project and week-long accompanying series on global trade issues from ‘Ideas Lab‘.
As the authors describe, the tool maps global trade against economic opportunity and quality of life indicators with the purpose of examining the relationship between global trade and social and economic factors within and between countries around the world.
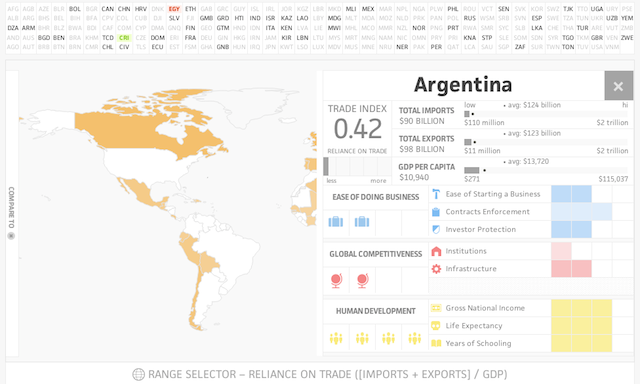
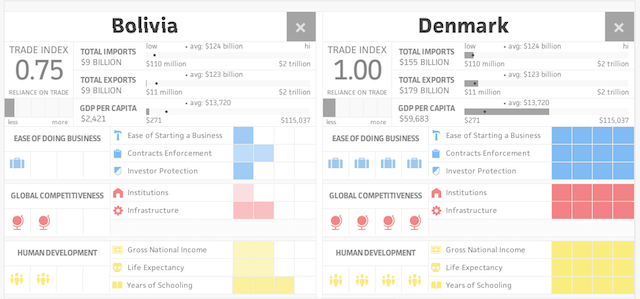
The project is primarily based on a navigable map and/or list of country codes that enable you to compare one country’s trade ‘data card’ with another. Each card is packed with indicators about the country’s reliance on trade, including matters such as the ease of doing business, the country’s global competitiveness and the Human Development Index for context.
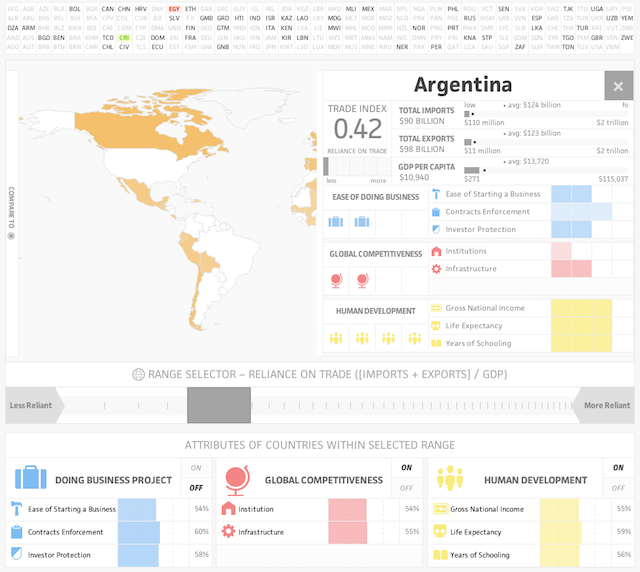
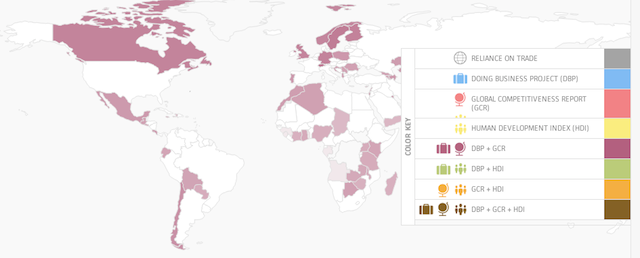
You also have the ability to create your own colour pallete and interact with a sliding range selector to view the reliance on trade of countries up and down the spectrum. By toggling the inclusion or exclusion of the blue (doing business), red (global competitiveness) and yellow (HDI) factors, you see a colour mix applied to the profiled countries at each point on the selector to highlight their relative readings across these indicators.
There is a lot going on in this project so it is really helpful to be welcomed by a screen full of explanatory annotations and instructions. Like we saw recently with the project ‘Kindred Britain‘, don’t just dive in and expect to be immediately intuitively capable of interpretation/understanding, it needs a bit more patience and careful navigation before you reach that stage.
I therefore found it really helpful and refreshing to see this project avoiding the lazy option and just putting out a tool, abdicating responsibility for how effectively users interact with and unearth findings from the tool. Instead, the designers/authors have created four sections of key Q&As including key insights, functionality, elements of the data visualisation, and data analysis. There is also a detailed blog post that provides more depth about the background, workings and findings of the project.
