

There is never a short supply of dumb charts, particularly thanks to the totemic uselessness of outlets like Fox news. However, sometimes you see an example that leaves you quite frozen with fascination: How did it come to be? What were they thinking? How many people let this pass through the approval for usage? And of course the most pertinent question, WTF?
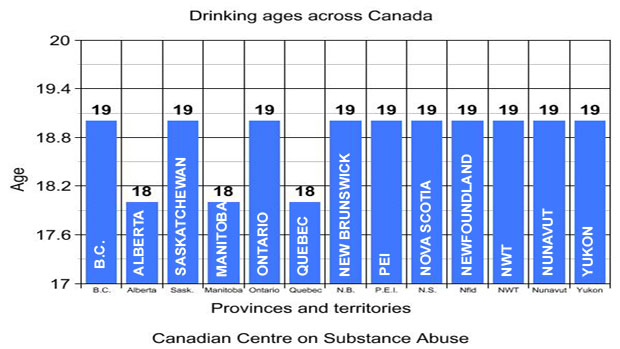
Ladies and gentlemen, I give you this piece from CBC news that accompanied the title ‘Drinking age will remain 19 in Saskatchewan’. I think my favourite feature has to be the axis scale, just inspired stuff.
Thanks to many people on Twitter overnight for sharing this, the first one came from Richard Johnson.
Dumbest bar graph Steve Murray has ever seen – bit.ly/W0coig – and he has seen a few. #dataviz #infografik #datafail #graphfail #eh
— Richard Johnson (@newsillustrator) March 4, 2013
