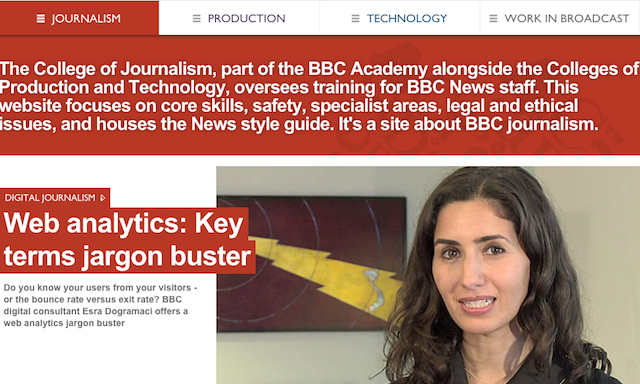
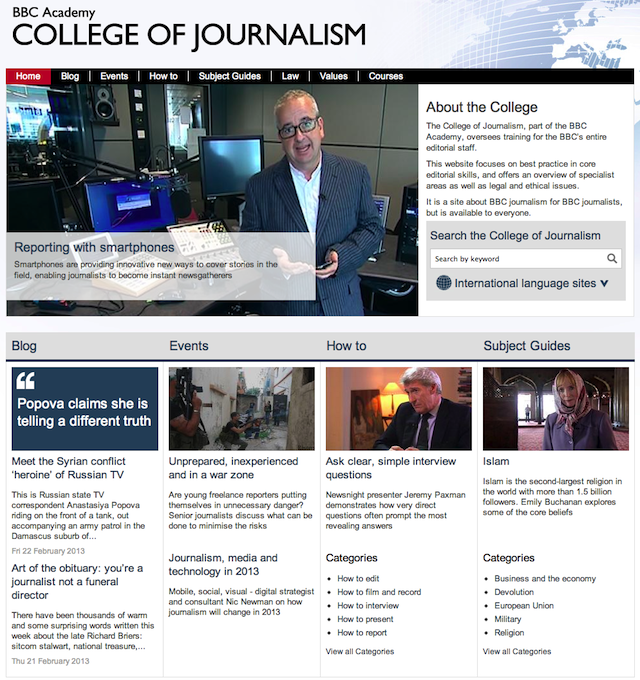
I came across this online resource by chance but the BBC College of Journalism site looks an excellent repository for some handy tips about all sorts of communication-related disciplines that can be applied to the practice of effective data visualisation, such as reporting, presenting and good writing.
Surprised to see no data visualisation/graphics section on their as yet (unless I’ve missed it) but given the recent increase in visibility and activity of the BBC’s graphics and interactive work this would appear inevitable.


