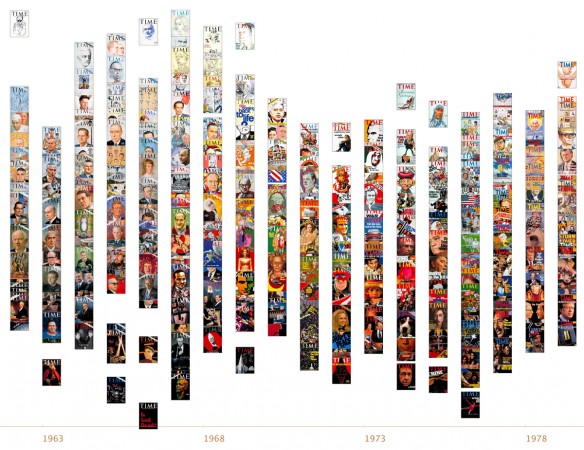
In recent times we have seen a number of emerging projects which demonstrate the creative potential of the visual analysis of images and image data. Projects such as Cinemetrics, Movie Barcodes and the 365 Days of Light in Norway demonstrate what can be achieved when the characteristics of images are stretched, spliced, aggregated and transformed.
Now we have a new addition to this fascinating branch of data visualisation with the release of ImagePlot, a powerful, free software tool which allows you to visualise entire collections of images and videos of any size.

ImagePlot was developed by the Software Studies Initiative with support from a number of academic, research and funding partners. The Initiative is led by Lev Manovich, Professor of Visual Arts at the University of San Diego, California, one of the most influential and celebrated voices in the field of digital humanities.
The basis of ImagePlot is the visual arrangement of collections of images as timelines and scatterplots to facilitate the analysis of clusters, outliers, trends and patterns. The data used to form such arrangements comes from the underlying metadata (such as date created, filename) or visual properties (such as hue, shape, brightness), data which is gathered by the macros included in the tool which automatically mine these characteristic from within a collection. You can also use ImagePlot to explore patterns in films, animations, video games, and any other moving image data.
The download is free and available now and you should read more about the tool in greater detail than provided here. The only other tool I can think of to compare it with is the Microsoft Silverlight PivotViewer development.
You can view a Flickr gallery of the early creations developed using ImagePlot and explore a number of articles by Manovich and colleagues that address methodologies for exploring large visual cultural data sets. You should also check out these digital humanities projects which use ImagePlot.

