Yesterday saw the high profile launch of the Government’s Police.uk portal for exploring local crime and policing information for England and Wales, a huge step forward in the ongoing movement towards open data.

The site fundamentally acts as a police information portal, providing contact details for local policing team, twitter feeds relating to local issues involving the nearby Force, details of how to get involved in neighbourhood watch schemes as well as instructions for how to report crime.
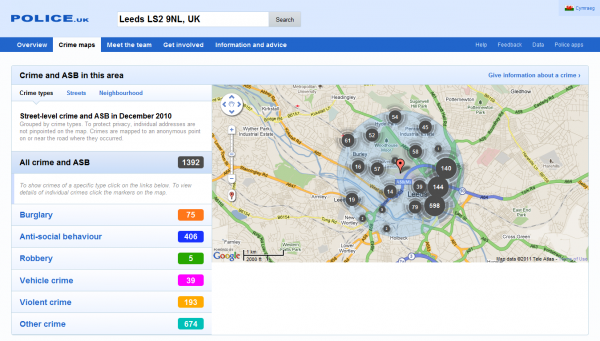
But the main feature of the site is a mapping tool allowing users to enter a postcode and discover the volume of ‘street-level’ crimes and anti-social behaviour incidents (ASB) in that area over the previous full month.

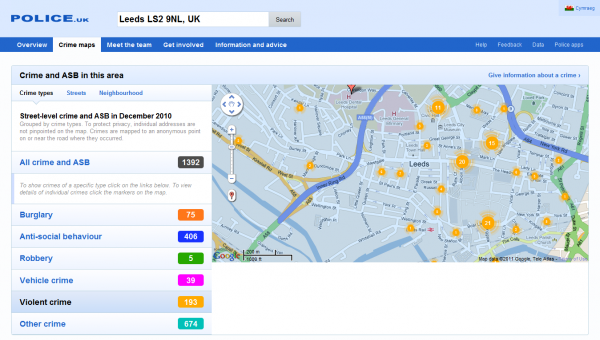
This default display reveals the aggregate number of crimes and ASBs in that postcode area, with the option to narrow down the display to show information about Burglaries, ASBs, Robberies, Vehicle Crimes, Violent Crimes and a broad category for all Other Crimes.

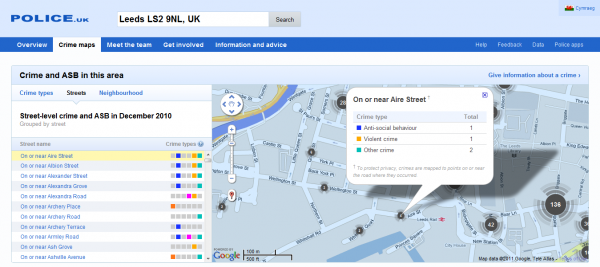
To protect privacy, individual addresses are not pinpointed on the map, instead crimes are mapped to an anonymous point on or near the road where they occurred with their size modified to reflect the volume of records at each location. You can modify the display to show summaries by specific streets or neighbourhoods.

There is also the ability to obtain a full data download for each Force area and an API facility to encourage people to use the data and develop additional facilities as apps.
Criticism
The past 24 hours since the launch of this service has seen a great deal of negativity which is unfortunate and largely over the top, but some genuinely constructive feedback has emerged from the noise.
The main issue concerned widespread problems accessing the site. It is no surprise, given the amount of news and press publicity in the lead up to the site going live, that it struggled to cope with demand. As the BBC reports, at its peak yesterday there were 5 million hits per hour/75,000 per minute causing it to be unavailable for long periods. That is a staggering amount of interest and demonstrates the appetite for this sort of information.
The second matter has been the decision to geographically display the location of crimes at an anonymous geometric centre point rather than on the location of the recorded crime/incident. This graphical ambiguity has been criticised by the British Cartography Society citing it as a frustrating example of ineffective mapping techniques, one which enrages cartographers and ultimately provides the end user with little information. The Guardian article Too Much Information also touches on the issue of how people are supposed to use this aggregated, geographically averaged data.
The main issue concerns the use of centralised dots to represent data when they portray what area that data is supposed to represent – which road boundaries, which villages, which properties are included or excluded? In the absence of detailed geographical plots at property level the more effective method would have been to use shaded areas to represent the geographical region covered by each aggregated data point, encoding the quantities through the shade or hue. A proportion of crimes/incidents per population would contextualise the levels better than absolute volumes.
When I worked for the Police several years ago I was fairly close to the development of one of the earliest pioneering attempts to make police data more transparent using a similar map-based approach. I therefore appreciate the difficulties associated with presenting crime or incident data down to property level – there are significant potential political and legal ramifications in doing this.
Ultimately, a certain safety-first approach takes precedent but this can have reverse consequences – a geographical centre-point still lands somewhere on a map, possibly a crime-free property, but this could give the false impression that is the crime hotspot!
I suspect the initial strategy with the police.uk displays has been to launch an initial ‘safe’ approach to provoke reaction, test out opinions and trigger debate. Then, hopefully, when there is greater confidence in the project’s scope, the fully detailed potential of this data will be unleashed.
