
Following the popularity of the Visualising the World Cup 2010 post I published last week, here is something of a sequel presenting a whole host of further examples. Many thanks to all who submitted comments, tweets and sent me emails with suggested links to some of the items displayed below. The visualisations and information devices I have presented here fall in to the following categories:
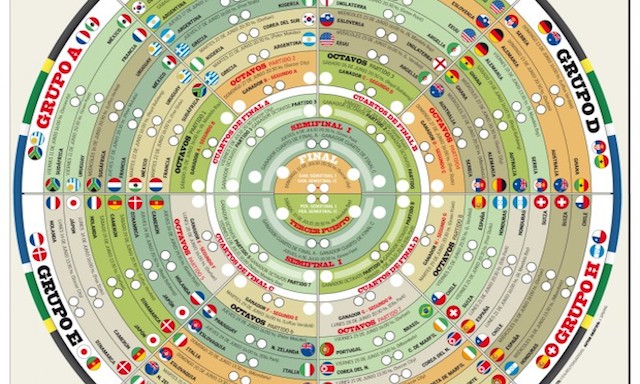
- Match fixtures and tournament schedules
- Results, analysis and tournament statistics
- Guide to the venues and stadiums
- Group/team/player guides
- World cup history
- Other miscellany…
ta
MATCH FIXTURES AND TOURNAMENT SCHEDULES
World Cup game tracker by Positive

Innovative World Cup wallchart via dj-dsl

Match schedule and tournament infographic published in superdeporte, via newspagedesigner

World Cup Infographic from the Rockford Register Star (via www.visualeditors.com)

RESULTS, ANALYSIS AND TOURNAMENT STATISTICS
BBC World Service ‘World Cup Team Talk’ interactive match stats

(with background details here)


Castrol/FIFA match and tournament statistics

…including the animated goal replays

The Guardian datablog presents analysis of England’s passing accuracy along with a free data download of Opta’s complete match data/statistics from the England vs USA game.

Typical visualisation approach in the New York Times ‘Goal’ blog


VisualSport’s player vs. player analysis dashboard

Detailed visualisations and statistics from the TotalFootball2010 iPhone app


‘Libero’ the BBC’s live tv analysis tool


GUIDE TO THE VENUES AND STADIUMS
Special guide to the South Africa venues published in Superdeporte, via newspagedesigner


GROUP/TEAM/PLAYER GUIDES
Map of qualifying countries via chartsbin


Also from Estadao, a classic 8-bit type design detailing the brazilian squad members

Profile of 10 (likely) prominent players in the tournament by Estadao of Brazil

A stylish interactive profile of some of the important players at the tournament, by El Mundo

WORLD CUP HISTORY

Tableau’s World Cup History visualisation

OTHER MISCELLANY…
El Mundo’s interactive graphic about the history of the World Cup ball

Interactive infographic detailing the much talked about Vuvuzela by lainformacion

Graphic detailing the carbon footprint of the World Cup produced for EU Infrastructure

World Cup technology milestones down the years from Gizmodo

Very fitting for this section is Ben Schott’s Soccer World Cup Miscellany from the NY Times

